Coin Metrics' State of the Network: Issue 81
Tuesday, December 15th, 2020
Get the best data-driven crypto insights and analysis every week:
Weekly Feature
Bitcoin As A Hedge Against Inflation
By Nate Maddrey and the Coin Metrics Team
For most of its existence institutions have stayed away from investing in bitcoin, typically citing it as a risky, speculative asset. Over the course of 2020, however, many institutions have started to endorse bitcoin. One of the most commonly cited reasons for this change of tune is the growing narrative that bitcoin could serve as a good hedge against inflation.
For example, in early May billionaire hedge fund manager Paul Tudor Jones announced that he had over 1% of his assets in bitcoin. He explained that he viewed it as a hedge against inflation, saying “we are witnessing the Great Monetary Inflation -- an unprecedented expansion of every form of money unlike anything the developed world has ever seen.”
In their recent report “Why Corporate Treasuries May Consider Bitcoin,” Fidelity Digital Assets cites potential inflation as one of the primary reasons that companies are starting to consider holding bitcoin in their corporate treasuries. MicroStrategy, Square, and others, have recently bought bitcoin and stated that they see it as a protection against inflation.
The rapid onset of COVID in early 2020 changed macro conditions seemingly overnight. Following the market crash of March 2020, central banks around the world began printing money and introducing quantitative easing measures coupled with aggressive fiscal stimulus at an unprecedented rate. In late March the US passed the CARES act, which provided about $2 trillion worth of stimulus money. As a result, the US M2 money stock, as seen below, grew more from about $15 trillion to about $19 trillion over the course of 2020. For context, the M2 money stock grew by less than $1 trillion from January 2008 to January 2010, following the 2007-2008 financial crisis.
Quantitative easing and growth of the M2 money stock does not necessarily directly lead to increased inflation, as newly printed money typically stays in bank reserves. But combined with mounting fiscal deficits due to lagging global economies, rampant quantitative easing has pushed federal banks to their limits and created conditions that could lead to a significant inflation rate rise.
Source: Federal Reserve Bank of New York, Center for Microeconomic Data
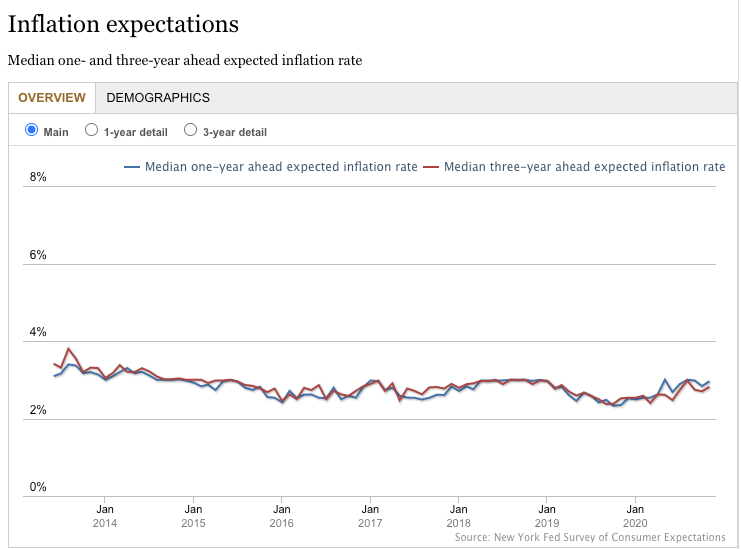
Although inflation rate is still around 2%, the uncertainty around potential future inflation has increased. In other words, while the current median estimate of expected inflation is still anchored around 2%, the variance in expectations has widened. This is reflected in the below chart from the New York Federal Reserve, which shows inflation uncertainty increasing to over 3% following March 2020.
Source: Federal Reserve Bank of New York, Center for Microeconomic Data
This increased uncertainty was also reflected in the Federal Reserve’s updated monetary policy statement released in August 2020. While the Fed has historically targeted a 2% inflation, the updated statement says it “will likely aim to achieve inflation moderately above 2 percent for some time.”
Bitcoin, in contrast, does not suffer from an uncertain monetary policy. One of Bitcoin’s core properties is its predictable supply schedule. New bitcoins are issued every time a new block is mined as a reward for the miner who successfully mined the block. This is the only way that new bitcoins can be created and is a key part of the Bitcoin protocol.
Bitcoin’s current block reward is 6.25, which means 6.25 new bitcoins are issued every time a block is mined. On average, blocks are mined every ten minutes, which typically means about 800-1000 new bitcoins are issued every day. There’s slight variance from day to day due to the unpredictable nature of exactly how often new blocks are mined (Bitcoin’s difficulty adjusts every two weeks to keep the average block time around ten minutes), but over the long term this supply issuance is deterministic and predictable.
Importantly, Bitcoin’s supply issuance is also transparent and auditable. Anyone can run a Bitcoin node and independently verify Bitcoin’s issuance throughout its history. The below chart shows Bitcoin’s daily issuance going back to 2012, smoothed using a 30-day rolling average.
Source: Coin Metrics Network Data Charts
Bitcoin issuance is decreased by 50% every four years. These halvings are also a core part of the Bitcoin protocol, and are predictable well into the future. The most recent halving occurred in May 2020, which dropped Bitcoin’s average annual inflation rate to below 2%.
Source: Coin Metrics Network Data Charts
Unlike fiat currencies, there’s a hard cap on the total number of bitcoin that will ever exist. Halvings will keep occurring every four years until the supply cap of 21M bitcoin has been reached. This means we can project well into the future, and have clarity about what Bitcoin’s inflation rate will look like 1, 5, or 10 years from now.
Source: Bitcoin - A Novel Economic Institution
Bitcoin’s predictable and transparent monterey policy is ultimately what makes it a good potential hedge against inflation. While the US dollar, and many other fiat currencies, face increased uncertainty about inflation expectations over the upcoming years, Bitcoin’s inflation expectations are predefined. Due to its regular halvings and maximum supply cap, Bitcoin’s inflation rate will decrease in the future, while fiat inflation rates may increase.
To check out some of the data featured in this article and explore more of our on-chain data, check out our free Network Data Charts tool.
Network Data Insights
Summary Metrics
Source: Coin Metrics Network Data Pro
Bitcoin and Ethereum network metrics were mostly flat over the past week, with a 2-3% decrease in active addresses for both assets. Bitcoin fees had the most noticeable dropoff of the week, declining by about 40%. Ethereum averaged almost twice as much in daily fees as Bitcoin: $2.3M to $1.2M.
USDC continued its growth, after supply passed 3B last week. USDC active addresses grew by 22.8% week-over-week, and averaged about 26K per day. Tether active addresses declined by about 10.5% week-over-week, but are still well above USDC at an average of 163.2K per day.
Network Highlights
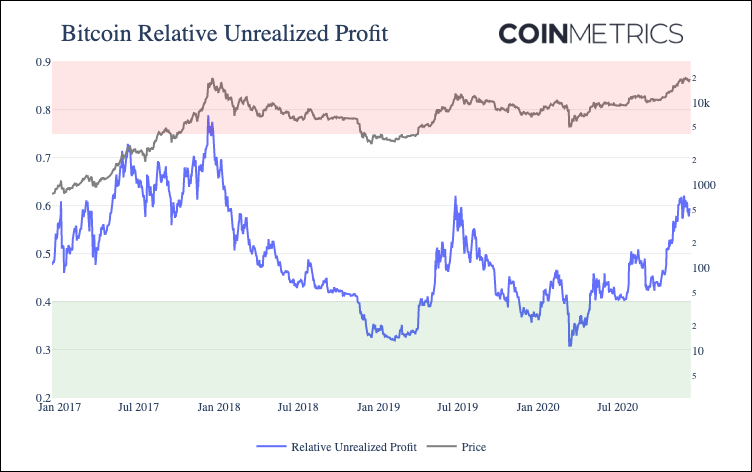
Bitcoin’s gross unrealized profit is the total amount of profit that could be made if each holder sold their coins at current market prices. To get a proxy for bitcoin’s total unrealized profit we use a metric called “gross unrealized UTXO profit.” Similarly to SOPR, gross unrealized UTXO profit estimates bitcoin’s unrealized profit on a UTXO by UTXO basis.
Relative unrealized profit ratio is calculated by dividing the total “gross unrealized profit” of bitcoin UTXOs (in USD) by bitcoin’s market cap. Historically, it has been a relatively accurate indicator of bitcoin market cycles. Bitcoin’s relative unrealized profit ratio increased to about 62% at the end of November, and dropped back down below 60% over the last week. Bitcoin’s relative unrealized profit reached a peak of 62% during July 2019. But the current level is still well below the December 2017 peak of 79%.
For more information about this as well as four other on-chain indicator metrics, check out our latest in-depth research report: The Bitcoin On-chain Indicators Primer.
Disclaimer: Although relative unrealized profit has been a historically informative indicator, there’s no guarantee it will continue to be accurate in the future. Please do your own research - this does not constitute investment advice.
Tether’s total supply has passed 20 billion. After initially launching on Omni, the Ethereum based version of Tether (USDT_ETH) and Tron based version of Tether (USDT_TRX) have both grown rapidly over the last year (see our report “The Rise of Stablecoins” for an exploration of why stablecoins have been exploding). Tether is still the undisputed leader of stablecoins, with over 5x the supply of any other stablecoin. But regulatory action is once again heating up with the recent introduction of the STABLE Act. Tether may once again come under fire in 2021.
Source: Coin Metrics Network Data Charts
Market Data Insights
Bitcoin prices approaching all-time highs again gives us an opportunity to examine the rolling drawdown of the major cryptoassets. Among the majors, only a handful of cryptoassets are just under or have recently exceeded their all-time high: Bitcoin, ChainLink, and Binance Coin. Most other cryptoassets launched in 2017 or before are still well below their all-time highs, with some such as XRP, Bitcoin Cash, and EOS still more than 85 percent below their all-time highs reached in late 2017 and early 2018.
Source: Coin Metrics Reference Rates
Such divergence in outcomes are positive. While fundamental analysis in the field of cryptoasset research is still in its early phases and industry-wide views on which network metrics matter has not yet reached consensus, we have seen cryptoassets with strong fundamentals (measured by a variety of metrics such as miner fees, adjusted transaction value, active address count, and active user proxies measured using supply dispersion) recover stronger. The fact that some assets are still well below their peak indicates that the market, at this stage of the cycle, is still discerning in what projects to divert capital to. The market has also evolved over the past three years allowing for much easier short exposure across a variety of assets, especially outside of Bitcoin and Ethereum. This represents a healthy market without any glaring excesses.
On the other hand, a market that exhibits excesses could be what we want. While bubbles can have damaging effects when they pop, they are very effective at drawing newcomers into the industry and incentivizing the build-out of critical infrastructure needed for the industry to scale. It is somewhat surprising that Bitcoin is almost at all-time highs but retail interest is still somewhat muted. Anecdotally, many colleagues who entered the market back at the height of the bubble have since exited the market or show indifference to cryptoassets now. These investors were much more likely to invest in cryptoassets outside of Bitcoin and Ethereum and experience heavy losses that may never recover.
CM Bletchley Indexes (CMBI) Insights
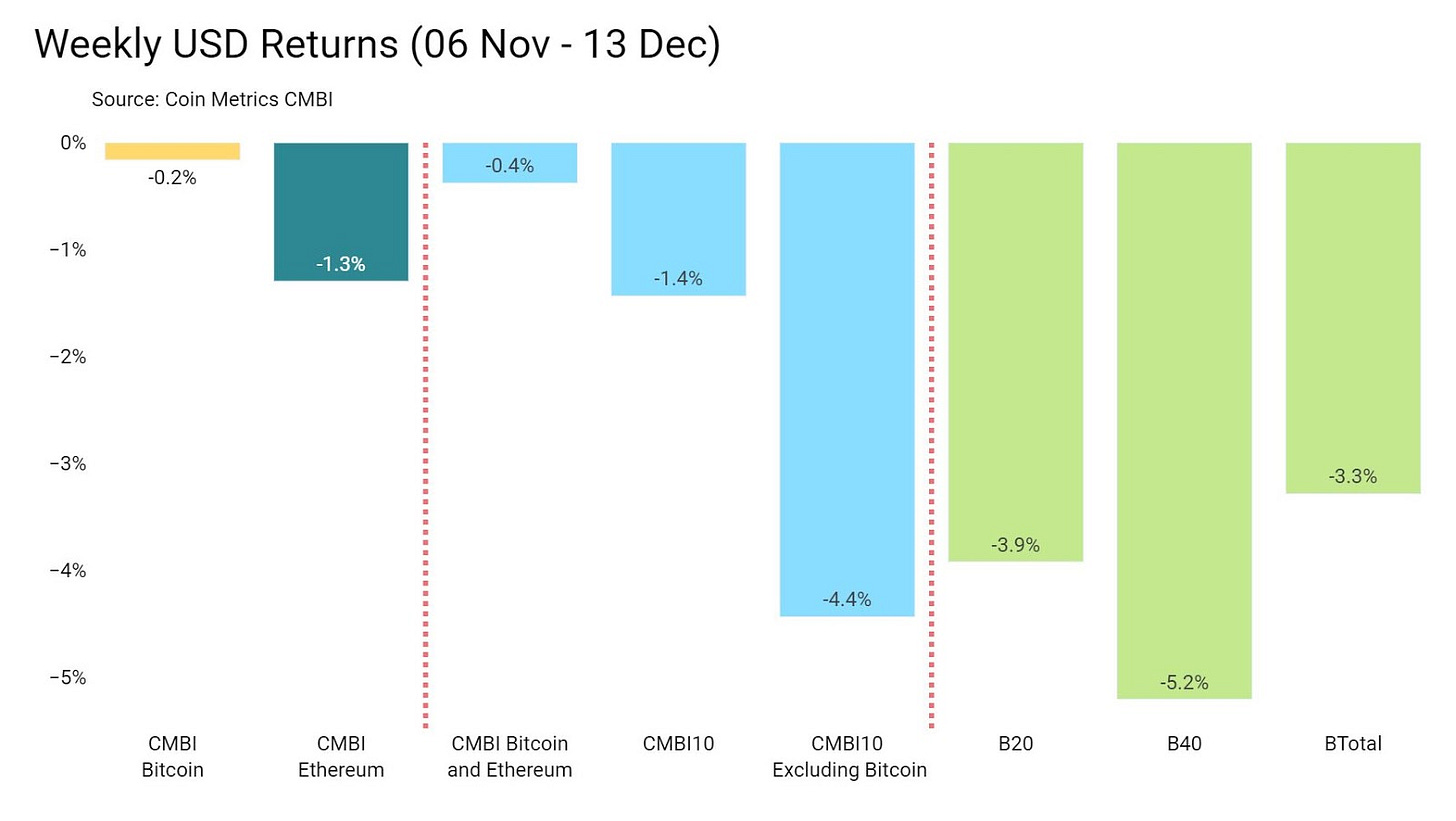
All CMBI and Bletchley Indexes were down for the week, with the large caps experiencing the smallest of the drawdowns. The CMBI Bitcoin closed the week at $19,139.14, down 0.2% after spending most of the week in the low $18,000s. The CMBI Ethereum had a similar week, falling over 8% mid week before recovering to close at $587.84, down 1.3%.
The crypto asset class outside of Bitcoin and Ethereum finished the week down more as evidenced by the returns of the CMBI 10 Excluding Bitcoin (large caps), the B20 (mid caps) and the B40 (small caps).
Coin Metrics Updates
This week’s updates from the Coin Metrics team:
We’re excited to announce the new Coin Metrics mobile app. View real-time cryptoasset pricing and relevant on-chain data in a single app! Download for free here: https://coinmetrics.io/mobile-app/
As always, if you have any feedback or requests, don’t hesitate to reach out at info@coinmetrics.io.
Subscribe and Past Issues
Coin Metrics’ State of the Network, is an unbiased, weekly view of the crypto market informed by our own network (on-chain) and market data.
If you'd like to get State of the Network in your inbox, please subscribe here. You can see previous issues of State of the Network here.
Check out the Coin Metrics Blog for more in depth research and analysis.


