Coin Metrics' State of the Network: Issue 124
Wednesday, October 13th, 2021
Get the best data-driven crypto insights and analysis every week:
Are BTC and ETH Spot Markets Maturing? Assessing the Health of Crypto Market Structure Using Order Book Data
By Kyle Waters and Nate Maddrey
In just a little over two weeks, October 31st will mark the 13th anniversary of the release of the Bitcoin white paper in 2008. Although the crypto market is still in its relative youth, crypto market structure is rapidly evolving and developing each day. As new institutional participants evaluate and enter the space it’s becoming increasingly important to measure the maturity of the emerging asset class. There are multiple ways to do this but one approach is analyzing crypto market microstructure (i.e., how crypto assets are traded).
One desirable feature of both crypto and traditional financial assets is deep market liquidity. In the context of centralized exchanges, market depth is the total amount of buy and sell orders in the order book. Deep markets with abundant quantity at prices close to the best bid or ask in the order book are preferable to thin markets because they can absorb large market orders with minimal price impact (slippage). In other words, high market depth implies better liquidity and ease of trading into or out of an asset.
Using Coin Metrics’ recently expanded order book snapshot coverage we analyzed how market depth for BTC and ETH spot markets on Coinbase, Kraken, and Gemini has changed over time. The CM Market Data Feed provides the top 100 bids and asks in the order book at 10-second intervals - we collected this data for each day since January 1st, 2020 (note CM coverage starts in April 2019). For each day we then calculated the average total quantity bid and offered across the top 100 positions in the order book and how far (in % terms) the price was from the best bid and offer.
BTC-USD Spot Market Depth on Coinbase, Kraken, and Gemini
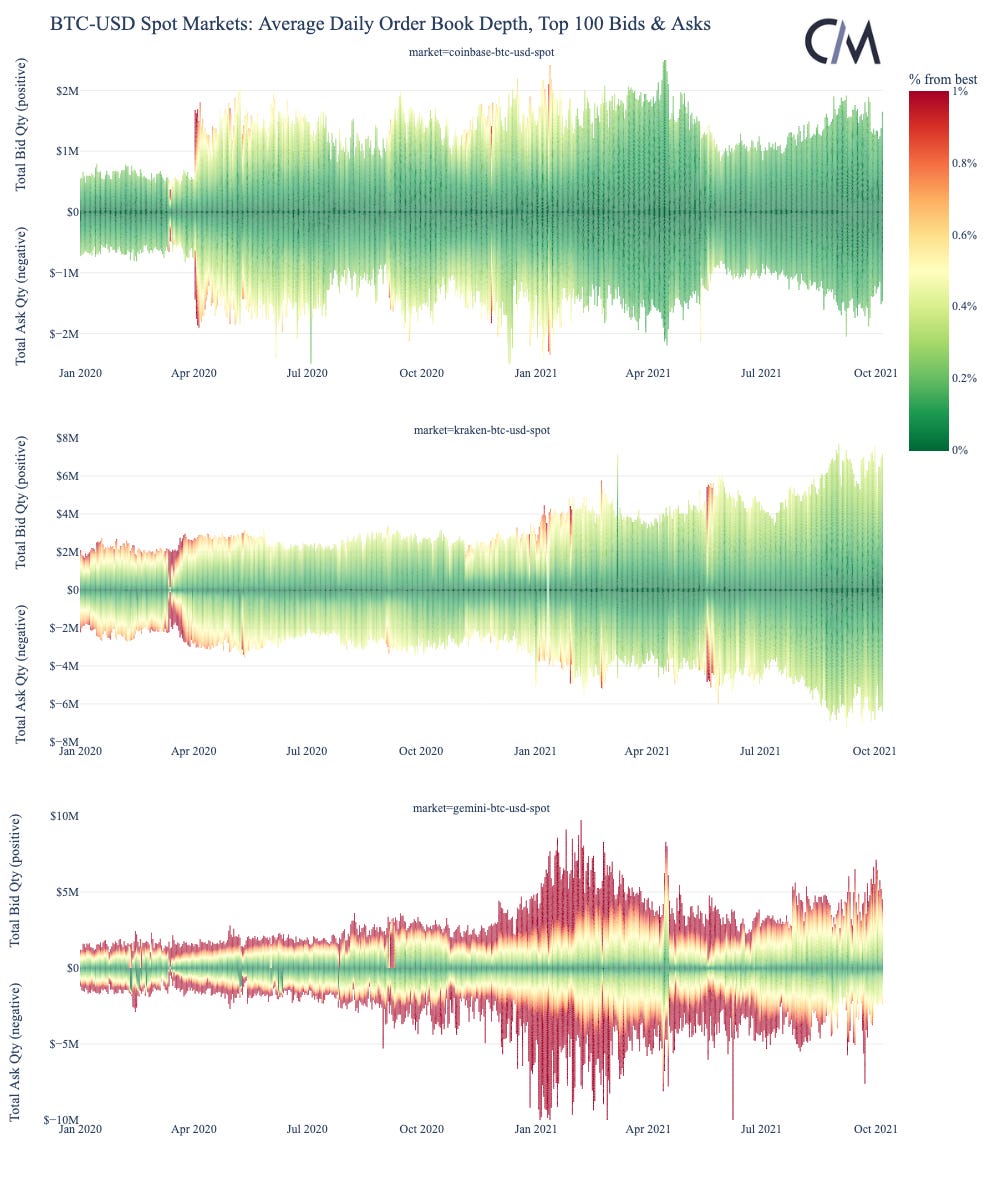
The chart below shows the average daily market depth and distance from the best bid/offer for BTC-USD spot markets for the three selected exchanges. On the y-axis, positive values indicate the total value of buy orders (in $) while negative values show the total value of sell orders. The color scale measures if the quantities offered or bid are at prices very close to the midmarket (dark green, closer to 0%) or far away (dark red, capped at 1%) from it.
Source: Coin Metrics Market Data Feed
BTC market depth has generally been improving over time for Coinbase, Kraken, and Gemini. It is tough to disentangle the effects of price volatility when measuring in dollar terms, but the market depth has mostly remained constant or increased, especially since the May crash earlier this year.
Looking across the three exchanges, the quality of market depth has also improved over time. In recent months, the top 100 bids and asks on Coinbase have all been within 0.2% of the best bid/ask. There is now typically $1.5M worth of depth on each side of the market within that range. While this is not a direct simulation of expected slippage or price impact, this suggests a market order of $1.5M worth of BTC would generally incur slippage costs of less than 0.2% on Coinbase today.
Similarly, there is about $6M worth of depth within 0.5% on Kraken and roughly a similar amount on Gemini within 1% of the best bid/ask. Note that different exchanges have different incentives and fee structures to attract market makers, complicating direct comparisons of market depth. Also, a comprehensive comparison would include the full market order book, not just the quantity in the top 100 bids and asks (CM has started collecting full order book snapshots for all markets at hourly intervals).
For the three selected exchanges, BTC-USD market depth also maps well to overall spot trading volume. Coinbase has the highest spot market share of the three and also has the deepest order book (within 0.2% of the best bid/ask).
ETH-USD Spot Market Depth on Coinbase, Kraken, and Gemini
Like BTC, ETH has had a transformative 2021 thus far and order book data points to a maturing ETH market. Like the BTC-USD analysis above, we calculated the average daily market depth for ETH-USD spot markets on Coinbase, Kraken, and Gemini.
Similar to BTC-USD, the total quantity (in USD terms) within the top 100 bids and asks has been increasing. This is largely due to the rapid price rise of ETH in USD terms but a more profound improvement is the quality of the market depth with prices closer to the best bid and ask. On Coinbase and Kraken there is now typically enough ETH on each side of the market available to absorb a $1M market order with less than 0.2% slippage.
Source: Coin Metrics Market Data Feed
The improving market depth for ETH across these three centralized exchanges is striking, especially considering that trading volume on DEXs, mainly Uniswap V3, now rivals centralized peers.
The strong market depth is also significant given the decrease in liquid ETH available for trading. At ~112M, ETH free float supply (CM’s measure of supply available to the market) is about the same level as it was in May of this year. Part of this is likely due to ETH being sent to the ETH 2.0 staking contract; there is over 7.9M ETH now in the staking contract.
Source: Coin Metrics Network Data Charts
Like BTC, ETH spot trading volume across these exchanges also correlates to exchanges with deeper market liquidity. Total ETH trading volume has skyrocketed in 2021, with total ETH-USD volume on Coinbase in Q2 and Q3 notably surpassing BTC-USD volume (Q2: $89B vs. $87B, Q3: $53B vs. $49B).
Conclusion
Spot order book data for BTC and ETH shows that the two assets are continuing to mature. This is especially important to large institutions with sophisticated execution strategies trying to minimize slippage costs. Furthermore, significant liquidity across many exchanges means that one particular market order will have less of an impact on the prevailing market price, improving price discovery and making potential manipulative tactics more expensive and unlikely. Deeper markets are also necessary for investment vehicles/funds that regularly liquidate holdings to meet redemption needs. As regulators continue to weigh exchange-traded funds and other crypto investment products, order book depth on crypto asset exchanges is essential data to pay attention to.
To explore the data used in this piece and our other market data and on-chain metrics check out our free charting tool, formula builder, correlation tool, and mobile apps.
Network Data Insights
Summary Metrics
Source: Coin Metrics Network Data Pro
BTC led the way this past week as price climbed back over $57K and market cap once again passed $1T. ETH was not too far behind with a 9.9% week-over-week market cap growth, compared to 18.5% for BTC. Transaction fees on both chains also surged as activity picked up. BTC fees grew over 75% on the week for a daily average of $894.6K. ETH fees grew by over 48% for a daily average of $35.9M. ETH active addresses averaged over 500K per day compared to 834.6K for BTC.
Network Highlights
As the Ethereum 2.0 merge draws nearer the amount of ETH held by Ethereum miners has climbed to new all-time highs. The following chart shows the total amount of ETH held in addresses that are one-hop away from an initial block reward payout. A majority of block rewards are paid out to mining pools who then distribute ETH to pool members, so addresses one-hop from mining pools typically represent individual miners.
Source: Coin Metrics Network Data Charts
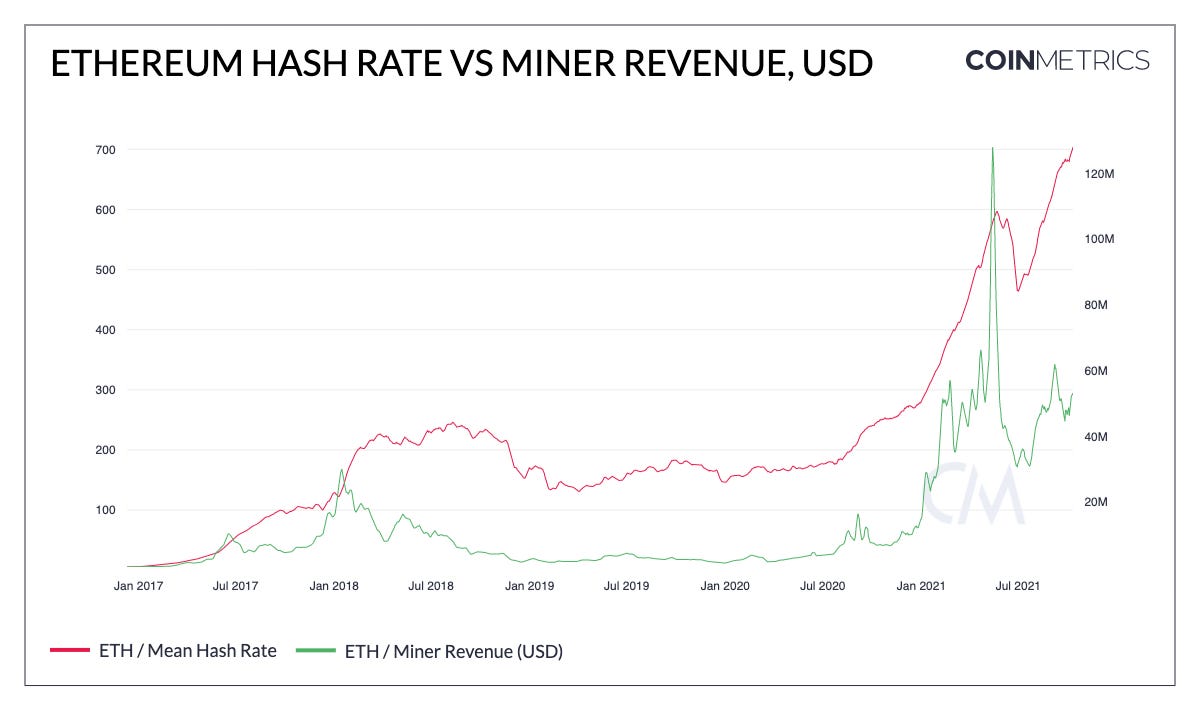
Ethereum hash rate has also climbed to new all-time highs in October. Hash rate temporarily dipped over the summer following the May crypto crash and Chinese miner exodus, but has rebounded over the last three months. The hash rate spike corresponds with a growth in miner revenue throughout August and September largely due to an increase in transaction fees from NFT activity. Although miner revenue has not reached pre-EIP-1559 heights, the $40M to $50M dollars of revenue generated daily has been enough to attract a steady stream of miners.
Source: Coin Metrics Network Data Charts
Coin Metrics Updates
This week’s updates from the Coin Metrics team:
Check out our market-data focused newsletter State of the Market, featuring weekly updates on market conditions.
The Coin Metrics mobile app provides real-time cryptoasset pricing and relevant on-chain data in a single app! Download for free here: https://coinmetrics.io/mobile-app/
As always, if you have any feedback or requests please let us know here.
Subscribe and Past Issues
Coin Metrics’ State of the Network, is an unbiased, weekly view of the crypto market informed by our own network (on-chain) and market data.
If you'd like to get State of the Network in your inbox, please subscribe here. You can see previous issues of State of the Network here.
Check out the Coin Metrics Blog for more in depth research and analysis.
© 2021 Coin Metrics Inc. All rights reserved. Redistribution is not permitted without consent. This newsletter does not constitute investment advice and is for informational purposes only and you should not make an investment decision on the basis of this information. The newsletter is provided “as is’ and Coin Metrics will not be liable for any loss or damage resulting from information obtained from the newsletter.


