Coin Metrics’ State of the Network: Issue 210
Token Unlocks & Free Float Supply Shocks in Digital Asset Markets
Get the best data-driven crypto insights and analysis every week:
Token Unlocks & Free Float Supply Shocks in Digital Asset Markets
By: Matías Andrade
Tokenomics—the economic models governing the issuance and distribution of digital assets—persists as one of the most important economic experiments taking place among digital assets. One intriguing aspect within this expansive domain is the mechanism of token unlock, where early investors and insiders like team members gain access to funds in a token that was previously locked to incentivize alignment with network interests.
From the standpoint of a classical economist, the unlocking of tokens, as an increase in the availability of a commodity, should exert downward pressure on its price. Early investors, now with unfettered access to their holdings, are free to sell or trade these tokens on the open market, effectively increasing the supply. This increase in liquid supply, ceteris paribus, should theoretically precipitate a price decrease, as dictated by the law of supply and demand.
However, these token unlocks do not take place in a vacuum, but within an intricate ecosystem of market participants and speculators that are constantly preempting market events in order to exploit inefficiencies for profit. Based on this premise, speculators should exert a countervailing force when token unlocks take place. After all, token unlocks are events that should be disclosed far in advance, and by the theory of efficient markets, token prices should already reflect this public information.
In this edition of State of the Network, we put this topic under the microscope by selecting a series of tokens that follow token unlock schedules and analyzing network supply and market data around the events. With knowledge of the ever-impeding presence of confounding variables, we nevertheless seek to present the data for a broad sample as an introductory examination of this complex topic.
Optimism ($OP)
Optimism is a Layer-2 scaling solution for Ethereum that recently (May 31st, 2023) had a token unlock of around 387M OP—equal to $396M and almost 60% of currently circulating supply. We can tell from looking at the trade volumes below that there is a period of high-volume activity preceding the token unlock, as well as bearish price action.
Sources: Coin Metrics’ Network Data Pro & Reference Rates
But this chart alone isn’t enough to quantify the characteristics and magnitude of token unlocks compared to other shocks to the circulating supply. To piece these together, we’re going to have to look at some on-chain metrics.
Free Float Supply
The free float supply of a currency is the freely-circulating supply that is detected to be “moving” by Coin Metrics methodology, based on on-chain analysis. This allows us to effectively exclude any supply that is locked up, either by investors, staked supply, or simply lost or burned supply. In combination with our other metrics, we can take a look at some examples to judge whether sudden changes in free-floating supply have consistent impacts on exchange prices.
Polymath—$POLY
Sources: Coin Metrics’ Network Data Pro & Reference Rates
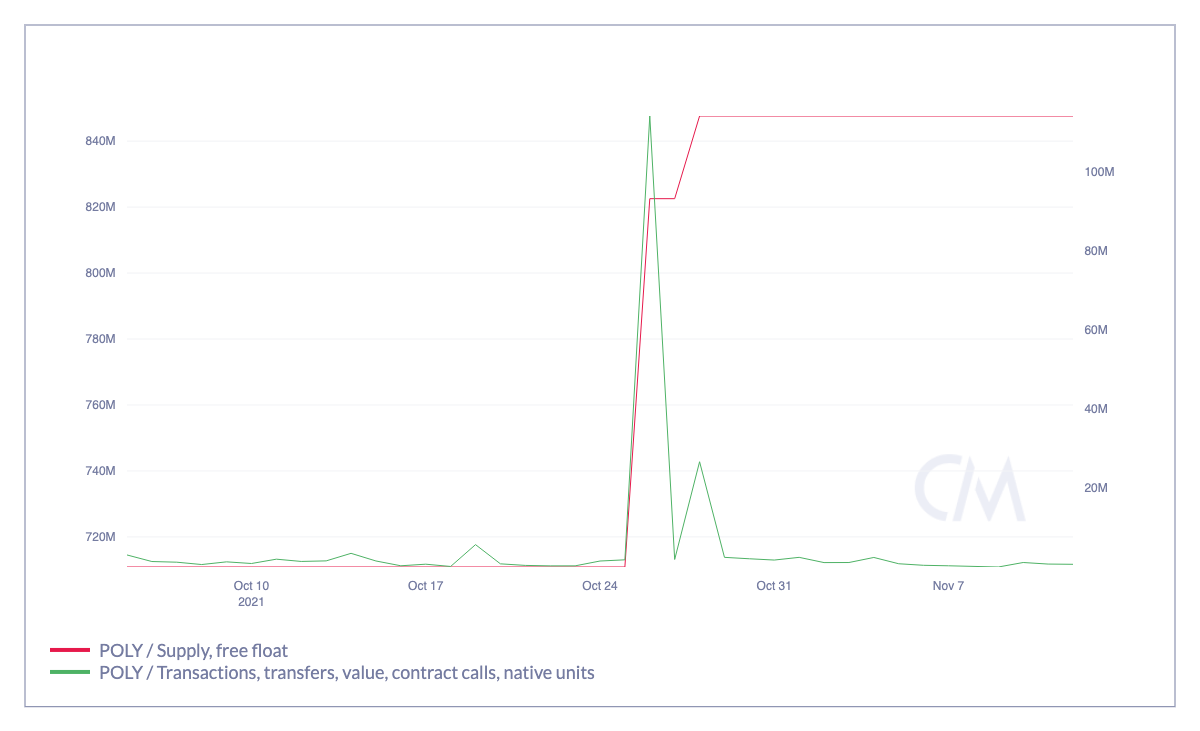
In this first case, the Polymath token had a large increase in free float supply, with more than 137M POLY supply being added to circulation. However, there doesn’t seem to be much volume being traded on the exchange. If we instead take a look at other on-chain metrics, we can see that a large number of transactions takes place on-chain, as seen below, which means this probably was not due to a token unlock. Indeed, we find that the new Polymath CEO was announced on this very date.
Sources: Coin Metrics’ Network Data Pro & Reference Rates
UMA—$UMA
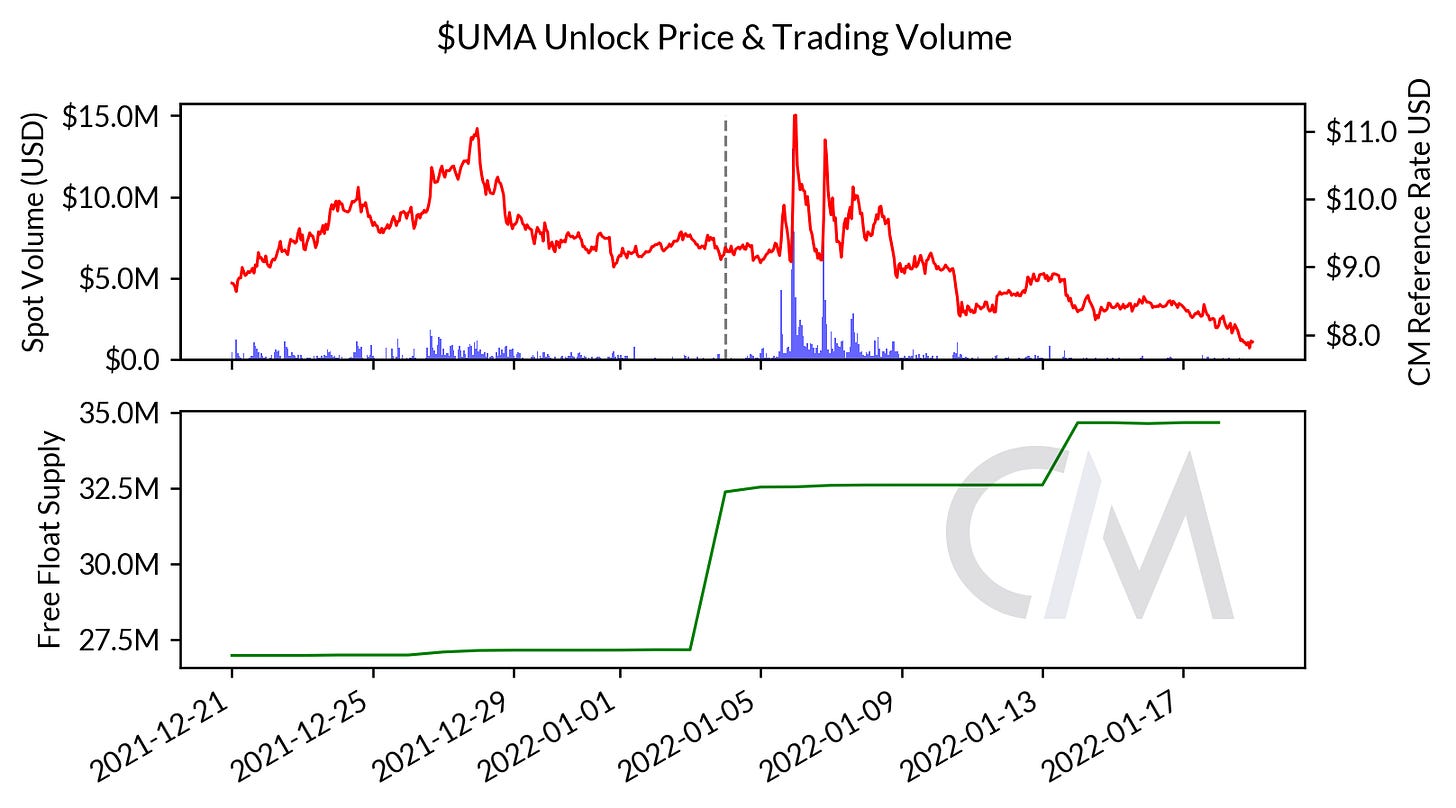
UMA is the case of a token where the free float metric rises in response to early investors getting access to their locked tokens as part of a 2-year vesting schedule, so there is no need to check for other confounding explanations. It is interesting to note that in this case there is a significant bout of trade volume for UMA across exchanges that follows the supply unlock, with significant price volatility as well.
Sources: Coin Metrics’ Network Data Pro & Reference Rates
Balancer—$BAL
BAL is an interesting snapshot because this change in floating supply isn’t due to a token vesting schedule as with UMA (because BAL has a linear vesting schedule). However, the change in supply amount of ~4M BAL is above the ~2.1M BAL afforded to founders and early investors by Dec. 2021. In this case, we see very little price impact and not much volume clustering around the change in supply.
Sources: Coin Metrics’ Network Data Pro & Reference Rates
Testing the EMH using $1INCH
One particularly interesting asset to consider is $1INCH—the governance token for the decentralized exchange aggregator 1inch Network—which has had plenty of steep cliff-like increases in its circulating supply. According to documentation released by the 1inch Foundation, the token follows a bi-yearly unlock schedule—only 6% of the token’s total ~1.5B of supply was released at its airdrop launch in December 2020. The remaining tokens unlock over a four-year period that culminates at the end of 2024.
Given that the token launched back in 2020, there is plenty of price history to analyze. The chart below shows the progression of free float supply and the price history of $1INCH to date.
Sources: Coin Metrics’ Network Data Pro & Reference Rates
One of the first big $1INCH unlocks occurred in December, 2021, with a scheduled vesting of around 200M tokens being released to the team and investors. The upper chart below shows the Coin Metrics’ reference rate and reported spot volume for $1INCH, with the free float supply plotted below. Spot volume and price both increased rapidly before the unlock, before price fell a few days later.
Sources: Coin Metrics’ Network Data Pro & Reference Rates
Another similarly-sized increase to free float supply was observed in January, 2022. The impact to spot volume was muted, as well as the immediate impact to spot price.
Sources: Coin Metrics’ Network Data Pro & Reference Rates
The history of $1INCH suggests a prior point that token unlocks are ultimately events taking place in a complex and fast-moving environment, where teasing out the idiosyncratic impact of a token-specific event requires careful analysis amid confounding factors.
Price Change Analysis
After looking at some examples of instances where the free float supply can increase suddenly, we can try and measure the average difference in price for sudden and large increases in free floating supply. Compared to the overall sample, collected for approximately 3 YTD, the measure of the daily average price change increased by 0.7%. This result suggests that, on average, inflationary changes in circulating supply—even large ones—have a marginal impact on prices. However, it is worth noting that the impact in each specific case will be dictated by a variety of factors, including market conditions.
Sources: Coin Metrics’ Network Data Pro & Reference Rates
Such a modest uptick starkly contrasts with prevalent expectations, which often predict drastic price corrections as a response to supply unlocks. However, further analysis might reveal effects across different time periods, or by categorizing market periods into bullish or bearish.
Conclusion
The data presented above shows that when taken at face value, it is hard to tell whether token unlocks should be viewed as cataclysmic market events. In this piece we’ve presented a basic primer to the data using Coin Metrics’ reference rates and network data. However, there are plenty of ways this analysis could be improved upon. For example, one could use a crypto market index to calculate excess returns and take into account the overall market performance. Different levels of granularity could be used. Finally, a deeper analysis of on-chain token flows could yield a clear breakdown of the percentage of tokens unlocked and sold on decentralized exchanges or sent to exchange wallets.
In many ways, the discussion of token unlocks is a reciprocal to the famously-debated impact of halving cycles in Bitcoin and its various forks, where the issuance of newly-minted bitcoin in a block is cut in half roughly every four years. With Bitcoin’s next halving just under one year away and Litecoin (LTC) set to experience a halving this summer, whether these supply events are priced in—or otherwise—will continue to encourage our objective data analysis, as well as a taste of philosophical inquiry into the behavior of underlying market participants.
Network Data Insights
Summary Metrics
Source: Coin Metrics Network Data Pro
Bitcoin daily active addresses rose 5% over the week while Ethereum active addresses rose 8%. With the high demand for ETH staking continuing to persist, the supply of Lido’s stETH token rose another 4% over the week.
Subscribe and Past Issues
Coin Metrics’ State of the Network, is an unbiased, weekly view of the crypto market informed by our own network (on-chain) and market data.
If you have any feedback or requests please let us know here.
If you'd like to get State of the Network in your inbox, please subscribe here. You can see previous issues of State of the Network here.


