Coin Metrics’ State of the Network: Issue 213
Measuring bitcoin's dominance in the digital assets ecosystem
Get the best data-driven crypto insights and analysis every week:
Bitcoin & the Rest: Measuring the First Cryptocurrency’s Hold on the Market
By Kyle Waters
As the first and most familiar of digital assets, bitcoin (BTC) has long enjoyed its position as the top crypto asset. Bitcoin’s dominance—its relative percentage of total digital asset market capitalization—has fluctuated but predictions of a reshuffling or “flippening” of the most valuable digital asset have, so far, not materialized. And on the back of last week’s frenzy of institutional news topped by asset management giant BlackRock’s spot ETF application, BTC has once again surpassed $30K while notching a gain of 85% since the start of 2023.
BTC is center stage and the market is reflecting it: BTC’s dominance is up to 58%, the highest since April 2021.
Source: Coin Metrics datonomy™
BTC’s dominance fell in spring 2021 as traders bid up smaller-cap altcoins, but never dropped below 40% of the total market. But with some newer tokens facing intensified regulatory scrutiny in the U.S., BTC has pulled ahead in 2023. BTC’s market cap of $590B is over $150B more than the rest of the datonomy™ universe’s aggregate $425B (excluding stablecoins).
Source: Coin Metrics datonomy™
Another point of comparison is the CMBI 10, Coin Metrics’ index of the 10 largest crypto assets. BTC’s weighting in the CMBI 10 (current constituents) is also at a 2-year high of 65%.
Looking at a broader basket of assets, we can see that BTC’s 85% return year-to-date is outpacing most of the other major digital assets. In the datonomy™ universe of tokens with a current market cap of at least $1B, the only two assets with a greater return YTD compared to BTC are Bitcoin Cash (BCH) at 102% and Lido (LDO) at 104%.
Solana (SOL) and Ethereum (ETH) are still firmly in the green at 65% and 57%, respectively. But many other assets are lagging behind—with some even down YTD in spite of a broader market rally across assets perceived as riskier. As alluded to above, some of these assets are facing new challenges from the U.S. Securities and Exchange Commission (SEC). In the SEC’s recent complaint filed against Coinbase, it alleged 13 assets as securities including SOL, ADA, MATIC, FIL, SAND, AXS, CHZ, FLOW, ICP, NEAR, VGX, DASH, and NEXO.
Source: Coin Metrics Reference Rates
ETH, the second largest of digital assets by market cap, continues to track BTC closely and also maintain a foothold among financial institutions, but has struggled to keep up with BTC in recent weeks. However, with a free float market cap of $200B, ETH has a large lead in 2nd place and continues to dominate among the smart contract platforms.
Source: Coin Metrics Network Data Pro
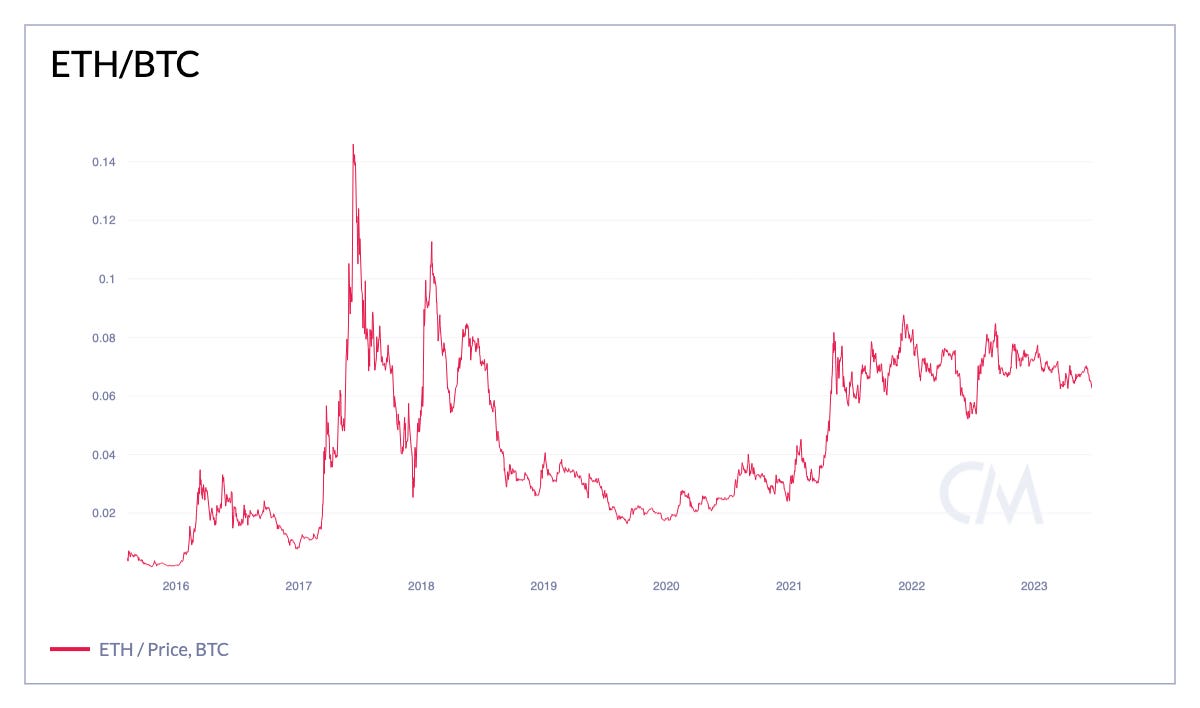
We can also compare the performance of ETH against BTC in the ratio of their prices (ETH priced in BTC terms). After reaching as high as 0.087 in December 2021, ETH/BTC is now at 0.061, the lowest level since last summer. Put differently, one bitcoin will currently get you about 16 ETH.
Source: Coin Metrics Market Data Feed
While it may be falling as of late, ETH is still stronger vs. BTC than it was in 2020, and much stronger than the 2,000 ether per bitcoin rate offered to ETH crowdsale participants in 2014. Furthermore, while BTC might currently be benefiting most from the tailwinds of a hopeful spot ETF approval, it is possible ETH will be right behind BTC in getting a spot ETF offered to investors in the U.S.
BTC's recent rally has also helped bring the asset’s 1-year trailing return back in the green after spending most of 2022 with a negative YoY return.
Source: Coin Metrics Formula Builder
Bitcoin is historically famous for its cyclicality and abrupt return potential. Though the past certainly provides no guarantees for the future, market participants are showing some signs of bullishness on the first cryptocurrency’s outlook.
Bitcoin’s dominance will be an important metric to watch moving ahead to assess the sentiment of the digital assets market, especially when measured against a complex regulatory environment for altcoins, and an opposing sense of optimism that a BTC spot ETF may finally be approved in the United States.
Network Data Insights
Summary Metrics
Source: Coin Metrics Network Data Pro
Active addresses rose 5% over the week on Bitcoin, averaging 957K per day. In the stablecoin ecosystem, the free float supply of Tether on Tron fell sharply to 43B while USDC supply rose slightly over the week—the first week-over-week rise in USDC supply since April. But at 27B, USDC supply sits well below the 40B mark it started at this year.
Coin Metrics Updates
This week’s updates from the Coin Metrics team:
Check out this week’s issue of State of the Market where we recap a busy week in Bitcoin’s institutional adoption.
Earlier this month we released a sweeping new report fingerprinting Bitcoin ASICs to derive better insight into critical issues like Bitcoin’s energy consumption and E-waste. Check out The Signal & the Nonce here.
Bullish Exchange Data Now Available Through Coin Metrics’ Market Data Feed (release).
Coin Metrics to Supply Crypto Pricing Data for WealthAgile (release).
As always, if you have any feedback or requests please let us know here.
Subscribe and Past Issues
Coin Metrics’ State of the Network, is an unbiased, weekly view of the crypto market informed by our own network (on-chain) and market data.
If you'd like to get State of the Network in your inbox, please subscribe here. You can see previous issues of State of the Network here.


