Coin Metrics' State of the Network: Issue 34
Tuesday, January 21, 2020

Weekly Feature
Analyzing Exchange Health Using On-chain Supply
by Nate Maddrey and the Coin Metrics Team
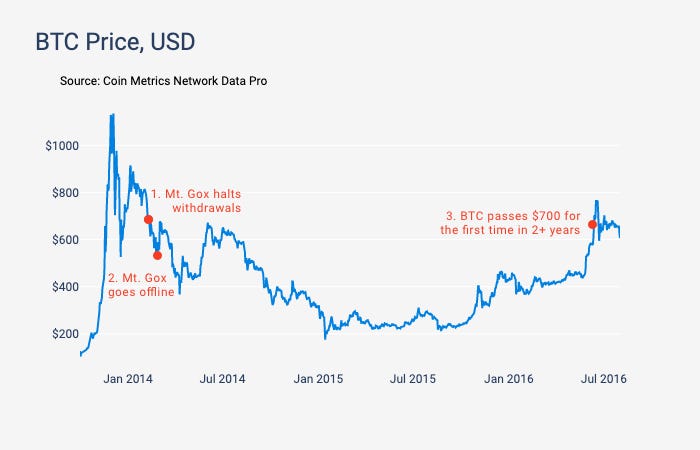
On February 7th, 2014, Japan based exchange Mt. Gox halted all Bitcoin withdrawals, claiming that they were trying to resolve an issue that was caused by "a bug in the bitcoin software.” Unbeknownst to the general public at the time, Mt. Gox had suffered number hacks and security breaches from various attackers over the previous few years. In all, about 850,000 BTC was lost, which was close to 6% of the total supply.
On February 6th, the day before the hack became public, BTC price was $763, and had topped $1,000 for the first time ever just two months earlier.
On February 24th, the Mt. Gox website went offline for good. That same day, BTC price dipped to $542, and would not top $700 again for over two years.

Source: Coin Metrics Network Data Pro
At the time of the hack, Mt. Gox reportedly accounted for over 70% of BTC trades. Exchanges can be a big potential systematic risk factor for the industry as a whole. If one particular exchange has a huge portion of the market share and that exchange is compromised, the entire market is adversely affected. Therefore, it’s crucial to track exchange activity to know if an exchange is becoming too dominant, and also in order to keep tabs on exchanges and look out for any suspicious activity.
In retrospect, the Mt. Gox hack was an inflection point for the cryptocurrency industry. It kickstarted a new push for accountability and regulation of exchanges that is still underway today. “Proof of reserves” is the idea that exchanges should publicly verify the reserves that they claim to hold. Although Kraken released a proof of reserves audit in 2014, the industry at large has still done little to move towards implementing proof of reserves. This is partially because proof of reserves poses operational challenges, and also presents potential security risks due to exchange addresses being publicly exposed. Exchanges allowing third party assessments of their balances could be an intermediate step. We welcome the opportunity to collaborate with exchanges on this domain, as they try and build user trust.
In this issue of SOTN, we analyze the amount of BTC and ETH held by exchanges over time using on-chain data. Analyzing supply held by exchanges gives a picture of which exchanges are getting the most usage, and if any exchange (or the market as a whole) is at risk.
Exchange Data Overview
At Coin Metrics we track exchange activity as part of our CM Network Data Pro offering. Specifically, we track the supply of BTC and ETH held by most major exchanges, as well as the amount flowing into and out of each exchange. We do this by finding and tagging all of the addresses operated by each exchange and tracking the aggregate activity for those addresses. This requires a mix of automated and manual processes with daily oversight.
For this report, we cover the following exchanges: Bitfinex, BitMEX, Binance, Bitstamp, Bittrex, Gemini, Huobi, Kraken, and Poloniex. Although these exchanges cover a significant portion of the overall volume, it’s important to note that there are hundreds of other exchanges that we did not include in this analysis. Furthermore, our metrics are estimates of the real number of BTC/ETH held by exchanges - there is no way to know the true number unless exchanges prove their holdings through an independent audit. Notably, Coinbase is not included in this report, but we are actively working towards tracking it in the future.
The amount of supply held by exchanges can be thought of as an estimate of the exchange’s usage. Of course, it’s not a perfect measure. Exchange supply increases could mean there are more traders using the exchange, or it could be because more traders are effectively using the exchange as a bank to store their assets. But there’s some evidence that usage correlates with the amount held on exchange.
The following chart shows Poloniex’s BTC reserves compared to the amount of users connecting to the exchange’s websocket API (that is, the number of users that are online at a given time - not the total number of users with accounts). As BTC reserves declined, so did the number of active API users.

BTC and ETH Supply Held by Exchanges
Over the last five years, the total amount of BTC held on the nine exchanges in our sample (Bitfinex, BitMEX, Binance, Bitstamp, Bittrex, Gemini, Huobi, Kraken, and Poloniex). has generally trended upwards, regardless of market conditions. The following chart shows the aggregate amount of BTC held on the exchanges plotted against BTC’s USD price.

Source: Coin Metrics Network Data Pro
Individual exchanges, however, have more volatility. While some exchanges, like Binance, have continued to grow after the 2018 price bubble, others, like Gemini and Bittrex, saw a large increase in early 2018 and have since leveled off. One other thing to note is that Bitstamp previously moved their cold storage back and forth between Xapo, which caused a sudden dip in their supply.

Source: Coin Metrics Network Data Pro
This is reflected in the following chart, which shows each exchange’s percentage share (on a monthly basis, averaged over the month) of the total BTC held on the nine exchanges in our sample. Over the last five years, exchange supply distribution for the exchanges in our sample has become significantly more distributed, which is a positive sign for the health of the overall market.

Source: Coin Metrics Network Data Pro
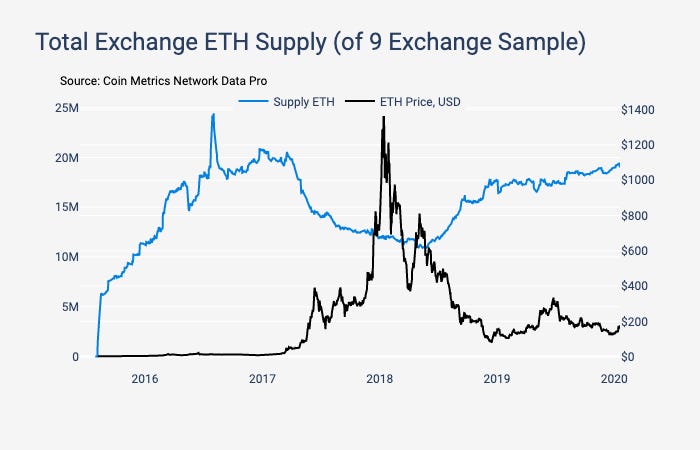
Unlike BTC, the total amount of ETH held on exchanges in our sample has not consistently trended upward over the last five years. It is difficult to draw global conclusions from this chart since our exchange sample for ETH supply only includes eight exchanges and does not include Coinbase, among others. But one interesting observation is that the the amount of ETH dropped significantly in 2017 and throughout 2018 during the price bubble peak and burst, and has since leveled out.

Source: Coin Metrics Network Data Pro
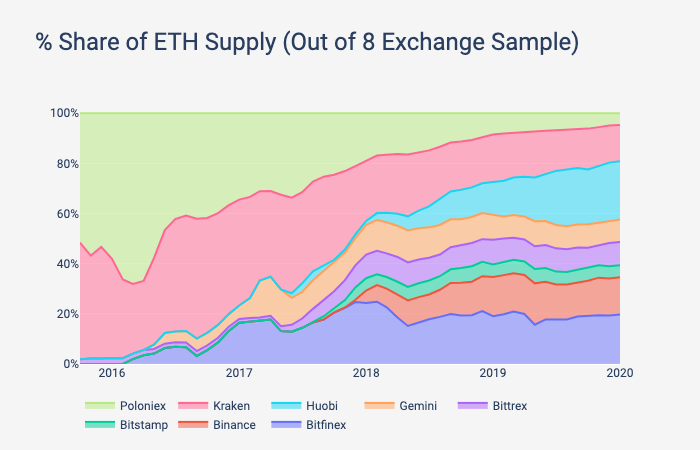
Kraken was the first major fiat exchange where ETH was tradeable, so accumulated a relatively large amount of ETH early on. But Kraken was unable to hold onto this early lead. Kraken held close to 9M ETH in January 2017 and had less than 3M by January 2018. Gemini and Poloniex also had their peak ETH supplies by early 2017 and have since declined.

Source: Coin Metrics Network Data Pro
ETH exchange supply has gotten more distributed over the last five years. As of January 2020, Huobi, Bitfinex, and Binance had 23%, 20%, and 15% of ETH supply, respectively.

Source: Coin Metrics Network Data Pro
Exchange Case Studies
On-chain exchange supply is also useful for tracking individual exchange activity. Below, we take a look at how key events affected the BTC and ETH supplies for three exchanges: Poloniex, BitMEX, and Huobi.
Poloniex
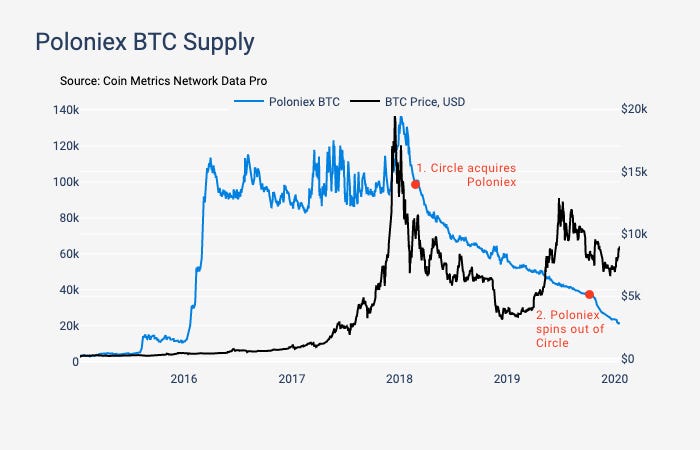
Poloniex launched in January 2014 and quickly became one of the largest exchanges in the world. During its early years, Poloniex thrived in a largely unregulated market. During 2016 and 2017, Poloniex handled a lot of altcoin trading. But by late 2017, Poloniex was plagued by support issues and was having trouble scaling quickly enough to cope with its new users.
Poloniex was acquired by Circle in February, 2018, with plans to work with regulators and improve Poloniex’s infrastructure. Those plans had a dramatic effect, as Poloniex’s BTC and ETH holdings began to plummet immediately after Circle’s acquisition. By October 2019, Circle announced that they were spinning out Poloniex as a separate entity. Poloniex officially ended support for US customers in November 2019 (and subsequently dropped KYC requirements for accounts with balances of less than $10k), sending their on-chain supplies to their lowest levels since January, 2016.


Source: Coin Metrics Network Data Pro
BitMEX
BitMEX is a Seychelles-registered derivatives trading platform that offers high leverage trading (up to 100x) on futures and perpetual contracts. BitMEX only allows for BTC deposits (and not ETH), but allows BTC to be traded against many other currencies.
Similar to Poloniex, BitMEX was also founded in 2014. But unlike Poloniex, BitMEX started off slowly and has been steadily growing over the last few years. Notably, BitMEX has increased their BTC supply during the 2018 bear market. However, it’s important to note that BitMEX has a relatively large “insurance fund” of BTC that reportedly grew by over 63% in 2019.
BitMEX has also suffered some recent setbacks due to regulatory issues. In July 2019, Bloomberg reported that BitMEX was officially under investigation by the U.S. Commodity Futures Trading Commission (CFTC) about whether BitMEX broke the law by allowing Americans to trade on their platform. This caused BitMEX BTC supply to temporarily dip, but it has since recovered. In November 2019, BitMEX revealed that over 20,000 client emails had been leaked as part of a security breach. However, this did not appear to affect BitMEX BTC holdings.

Source: Coin Metrics Network Data Pro
Huobi
Huobi was founded in 2013. Huobi had moderate success over its first five years of operations, but is most notable for its large increase in both BTC and ETH supply during the second half of 2019.
The PlusToken scam was a China based ponzi scheme which was similar in structure to Bitconnect. PlusToken reportedly stole billions of dollars worth of cryptocurrency over 2018 and 2019. It reportedly first started in early July, 2018 then abruptly stopped accepting payments on June 30th, 2019 after publicly posting the message “sorry we have to run.”
In August, 2019, reports first started coming out that BTC and ETH from the PlusToken scam were being sold in large quantities on Huobi. In December 2019, Chainalysis published research claiming that PlusToken coins can be tracked to a few OTC desks that were operating on Huobi. There has also been speculation that the PlusToken selloff may have been directly linked to the BTC rally and subsequent crash during the summer of 2019.


Source: Coin Metrics Network Data Pro
Conclusion
Tracking exchange on-chain activity is more important now than ever. As the industry continues to evolve and regulatory pressure increases, it is important to keep exchanges accountable and hold them to a high standard. Overall, exchange supply appears to be getting more distributed, and the public is starting to become more aware when exchanges are involved with suspicious activity, which is a positive sign for the health of the industry. Up to this point, exchange balances have largely been characterized by third parties like us. Moving forward, we welcome the opportunity to work with exchanges to attest to these findings, and hope to continue to see the industry moving towards transparency and accountability.
Network Data Insights
Summary Metrics

Source: Coin Metrics Network Data Pro
The major cryptoassets continued to trend upwards this past week. ETH and XRP transfers were both up, growing 10.5% and 20.7%, respectively. XRP also led the way in active address growth, growing 34.1% week over week. However, it’s important to note that XRP still has significantly fewer active addresses and transfers than BTC, ETH, LTC, and BCH. Notably, BTC usage and security numbers increased less than the other four assets in our sample, which was not the case for most of 2019.
Network Highlights
BSV thirty-day active supply increased 43% over the past week (from Jan. 13th - 19th), more than any other asset in the below sample of 17 major cryptoassets. This was likely related to BSV’s upward price action as it outpaced all major assets with a 67% price increase over the last week, as noted in the below Market Data Insights section.

Source: Coin Metrics Network Data Pro
BSV active address growth, however, was negative on the week. BSV active addresses decreased by 7% over the week, which is less than most of the other assets in our sample.

Source: Coin Metrics Network Data Pro
Market Data Insights
Nearly all cryptoassets are continuing to see moderate gains this week. Among the major assets, Bitcoin Cash SV (+67%) performed the best with some market participants attributing the price action to legal developments surrounding Craig Wright.
Recent market action demonstrates that cryptoasset markets are still susceptible to short-lived bouts of violent price swings. Bitcoin Cash SV was particularly susceptible because a significant number of its holders have not yet claimed their coins since the fork occurred (narrowly defined here as moving their coins from one address to another) and many reputable exchanges have delisted the asset. This creates a situation where liquidity is low, order book depth is shallow, and price discovery occurs on second-tier exchanges that are more amenable to price manipulation. Furthermore, gaining short exposure to assets like Bitcoin Cash SV is either extremely difficult or impossible.

Source: Coin Metrics Reference Rates
Ethereum Classic (+53%), Dash (+58%), ZCash (+44%), and IOTA (+30%) have similarly seen outsized gains over the past week. The fact that these types of movements happen with regular frequency suggests a momentum-based strategy related to these assets may be possible.

Source: Coin Metrics Reference Rates
We previously examined Bitcoin’s historical price cycles in State of the Network Issue 27. We found that the previous cycles indicate a pattern of lengthening where each cycle takes longer to complete than the previous cycle -- an expected result if cycles are driven by a new wave of adoption and awareness from a certain group of users, each bigger than the last.

Source: Coin Metrics Reference Rates
Bitcoin’s price correction following the summer of last year has put the current cycle inline with the previous cycle that started in early 2015. If historical price cycles are reliable guide, we should expect further periods of only moderate price growth interspersed with brief periods of rapid growth and corrections.

Source: Coin Metrics Reference Rates
Still, market sentiment seems to have significantly improved over the past month. Looking at the distribution of estimated cost basis (an extension of the realized capitalization concept that we discussed in The Psychology of Bitcoin Bubbles as Measured by Investor Cost Basis) reveals that about 72% of all Bitcoin now has unrealized gains. This is a significant improvement from one month ago where this metric stood at 50%. The current distribution shows that the vast majority of Bitcoin has an estimated cost basis less than $12,000 and that at these levels, only a small increase in price is needed to dramatically improve investor sentiment.

Source: Coin Metrics Network Data Pro
CM Bletchley Indexes (CMBI) Insights
All CM Bletchley Indexes continued their impressive start to the year, performing extremely strongly again last week. Over the last year, it was infrequent to witness Bitcoin underperform the entirety of the Bletchley indexes by as much as it did this week, with the CMBI Bletchley Index only returning 6.5% over the week. Comparatively, the Bletchley 20 (mid cap assets) performed the best during the week with the Bletchley 40 (small cap assets) not too far behind, returning 20.5% and 17.5% respectively.
Despite Bitcoin being one of the weaker market performers over the week, the Bletchley 10 Even was the strongest weekly performer. This was largely due to the staggering performances of Bitcoin SV (67%), Bitcoin Cash (26%) and Stellar (23%).

Source: Coin Metrics Bletchley Indexes
As mentioned above, this week’s performance continued the exciting start to the year for cryptoassets. From the first of Jan, all CM Bletchley Indexes have returned between 25% and 48%. The breadth of the performance across the market can be witnessed in the below chart, where it can be observed that the annual returns of the even weighted indexes has exceeded or been relatively similar to its related market cap weighted index.

Source: Coin Metrics Bletchley Indexes
Coin Metrics Updates
This week’s updates from the Coin Metrics team:
Coin Metrics is hiring! We recently opened up 5 new roles, including Blockchain Data Engineer and Data Quality and Operations Lead. Please check out our Careers page to view the openings.
As always, if you have any feedback or requests, don’t hesitate to reach out at info@coinmetrics.io.
Subscribe and Past Issues
Coin Metrics’ State of the Network, is an unbiased, weekly view of the crypto market informed by our own network (on-chain) and market data.
If you'd like to get State of the Network in your inbox, please subscribe here. You can see previous issues of State of the Network here.
Check out the Coin Metrics Blog for more in depth research and analysis.
