Coin Metrics' State of the Network: Issue 67
Wednesday, September 9th, 2020
Get the best data-driven crypto insights and analysis every week:
Weekly Feature
Improving your Futures Roll: An Overview of the Basis Trade
by Jon Geenty and the Coin Metrics Team
The following is an excerpt from a full-length report, which has been truncated due to space limitations. Read the full report here.
The ‘Basis’ Trade
One of the most popular trades for any commodity futures is the basis trade. This is when traders build a strategy around the difference between the spot price and futures contract price of a commodity. This exists in corn, soybean, oil and of course, Bitcoin.
There are a few different approaches you can take. If you expect that the difference between the spot and futures price will grow then you are long the basis, and inversely if you believe it will shrink then you are short the basis.
As a contract gets closer to expiration the uncertainty around its settlement price is reduced and theoretically should converge with spot. On the futures market in crypto this is generally measured as the difference between the perpetual or ‘perp’ contract and the futures contract. The perpetual contract is generally priced similar to spot with slight variations due to aspects such as the collateral allowed on the exchange and the funding rate which can vary in magnitude and direction based on the difference between the exchange’s mark price and underlying index price. For an overview of the Bitcoin perpetual swap market check out State of the Network Issue 62.
Why does this trade matter to the average crypto investor or market participant? As shown by the recent volatility and selloff over the Labor Day weekend, a lot of the volatility in the space can be exaggerated by changes in open interest of the futures contract. For example, if a trader has a long Bitcoin futures position with Bitcoin as collateral, a swift downturn in the market can force them out of their position (read: liquidate) and create additional selling pressure. The basis trade is one way to hedge that risk by taking an asset neutral approach.
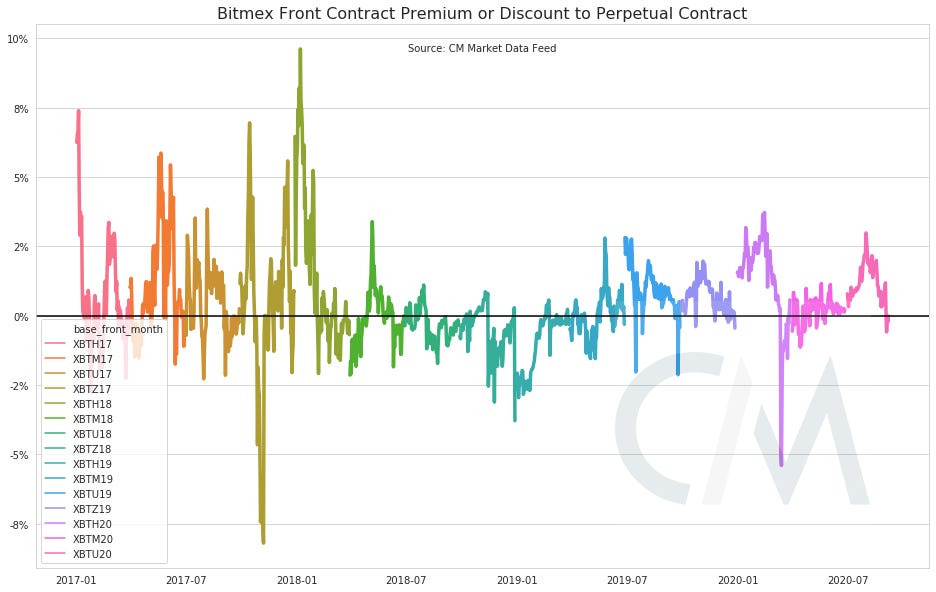
The premium/discount that the front contract has traded to the perpetual
Source: Coin Metrics Market Data Feed
Improving the Roll
For the purposes of this research we are going to look at the historical data from the Bitcoin futures on BitMEX due to the longer timeline and historical majority of volume. Similar futures are also listed on Deribit, FTX, Huobi, and OKEx. There are many futures contracts that currently exist and Bitcoin is one of many. As always, this is not investment advice.
A significant consideration about putting on a futures position is dealing with the expiry or settlement. You may recall the jokes earlier this year about oil futures going negative during the shock to demand and lack of parties wanting to take delivery. While traders of Bitcoin don’t have to worry about barrels showing up at their homes since all Bitcoin futures are cash-settled, they may want to roll their basis trade onto the next contract to avoid closing it out altogether.
From here on, when we refer to the “front” contract we are referring to the contract with the soonest expiration date. When we refer to the “next” contract, we are referring to the contract with the expiration date following the front contract. For example, if the date was September 1, 2020 and there was a contract with a Sept. 25 expiration, Dec 25 expiration and March 25 expiration, these could be referred to as the “front”, “belly”, and “back” contracts. For our purposes, the “next” contract would be the December 25th tenor. Below is a look at the spread between the perpetual and front month contract with the data points colored by days to expiration.
Source: Coin Metrics Market Data Feed
As you can see in the visual above, the premium or discount of the front contract to the perpetual is reduced as we get closer to the front contract’s expiration date.
Continue reading “Improving Your Futures Roll” here...
Network Data Insights
Summary Metrics
Source: Coin Metrics Network Data Pro
Bitcoin (BTC) and Ethereum (ETH) network fundamentals continue to look strong despite a drop in market cap. Daily transaction fees continue to grow across the board, with ETH fees reaching a new all-time high on September 1st. Increased fees lead to higher profits for miners and as a result hash rate is on the rise. BTC hash rate grew another 4.2% week-over-week and is on pace to once again reach new all-time highs. ETH hash rate also showed strong growth, rising 7% week-over-week.
Network Highlights
ETH’s 7-day average adjusted transfer value has flipped BTC’s.
On September 5th, ETH’s 7-day average adjusted transfer value reached $3.08B, compared to $3.01B for BTC. ETH’s average transfer value also remained above BTC’s for the following two days.
Source: Coin Metrics Network Data Charts
This is the first time since early 2018 that ETH’s 7-day average adjusted transfer value has topped BTC’s. ETH is increasingly being transferred between decentralized finance (DeFi) applications as DeFi apps built on top of Ethereum continue their rapid rise. Adding fuel to the fire, yearn.finance recently launched their yETH vault which allows users to earn interest on locked ETH. At time of writing over 200,000 ETH has been locked into the yETH vault.
Source: Coin Metrics Network Data Charts
Similarly, USDC 7-day average adjusted transfer value soared to a new all-time high this past week. USDC is used heavily in DeFi applications like Uniswap and Curve Finance.
Source: Coin Metrics Network Data Charts
Market Data Insights
After months of positive growth the major crypto markets fell back to late July levels this past week. As tech stocks came crashing back down to earth on September 2nd and 3rd, BTC and the rest of crypto began to drop as well.
Fueled by DeFi, ETH led the way over much of the summer. But the fast paced DeFi ethos has also led to some major implosions. Following in YAM’s footsteps, Uniswap clone SushiSwap gained over $1B of locked value in less than two weeks. But over the weekend SushiSwap’s pseudonymous founder cashed out their 2.5M SUSHI for about $13M worth of ETH, blindsiding the community and leaving the project in disarray. As a result, ETH fell harder than BTC this past week, dropping by 18% compared to a 12% decline for BTC.
Source: Coin Metrics Reference Rates
After selling out, SushiSwap’s founder transferred control of the project to FTX. FTX SUSHI-PERP open interest fell after the founder sold out, but has since somewhat rebounded, as seen in the below chart.
Source: Coin Metrics Market Data Feed
CM Bletchley Indexes (CMBI) Insights
It was a tough week for all cryptoassets, demonstrated through the poor performance of all CMBI and Bletchley Indexes. As has historically been the case during deep market sell-offs, Bitcoin has been one of the most consistent outperforming assets. This was demonstrated this past week by the returns of the CMBI Bitcoin Index, which only fell 11.9% relative to the CMBI Ethereum Index which fell 16.9% during the period.
The Bletchley 40, which has been the star performer throughout 2020 and is still up almost 150% YTD, had a week to forget. It was the worst performer of the indexes, falling 23.8%.
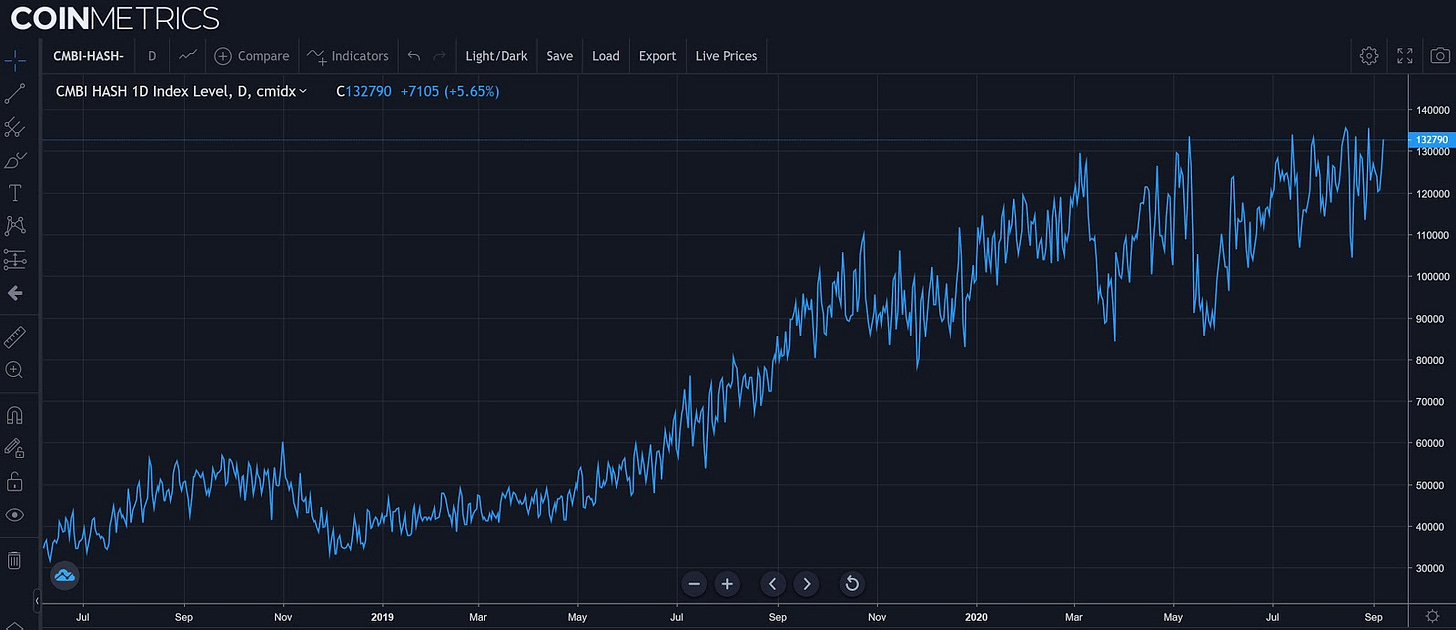
Despite the weak performance of the price indexes, the CMBI Bitcoin Hash Rate Index and CMBI Bitcoin Observed Work Index, which measure the performance of miners, continued to trade near all-time highs. At least in the short term, this demonstrates that miners remain unphased by the recent market price action.
Coin Metrics Updates
This week’s updates from the Coin Metrics team:
We’re excited to announce the new Coin Metrics mobile app. View real-time cryptoasset pricing and relevant on-chain data in a single app! Download for free here: https://coinmetrics.io/mobile-app/
As always, if you have any feedback or requests, don’t hesitate to reach out at info@coinmetrics.io.
Subscribe and Past Issues
Coin Metrics’ State of the Network, is an unbiased, weekly view of the crypto market informed by our own network (on-chain) and market data.
If you'd like to get State of the Network in your inbox, please subscribe here. You can see previous issues of State of the Network here.
Check out the Coin Metrics Blog for more in depth research and analysis.


