Coin Metrics' State of the Network: Issue 77
Tuesday, November 17th, 2020
Get the best data-driven crypto insights and analysis every week:
Weekly Feature
The State of DeFi Tokens
By Nate Maddrey and the Coin Metrics Team
The following is an excerpt from a full-length report which has been truncated due to space limitations. Read the full report here.
Decentralized finance (DeFi) took over the crypto world during the summer. But it cooled off after September, and has taken a back seat to BTC and ETH since.
In this week’s Feature, we explore the rapid rise of DeFi tokens and the current state of DeFi’s market cap and usage. You can check out our DeFi data and recreate many of the charts featured in this piece using our free community charting tool.
DeFi’s Third Act
Although it may seem like it popped up overnight, DeFi has been around for years. During 2018 early projects like MakerDAO (MKR) and 0x (ZRX) pushed the total DeFi market cap to over $5B, as Ether (ETH) price reached all-time highs. But the initial DeFi surge was dwarfed by this summer’s run, which saw the rapid entry of many new projects.
Source: Coin Metrics Network Data Charts
DeFi’s recent rise began in earnest in June with the launch of Compound protocol’s COMP governance token. COMP’s launch kickstarted the rise of decentralized lending and borrowing, which served as the initial fuel for DeFi’s surge. Compound lets users borrow cryptoassets like ETH, DAI, and USDC using crypto as collateral. It also lets users lend their cryptoassets and earn yield, which has become a cornerstone of DeFi investing. In addition to Compound, Aave protocol has grown to be one of the largest DeFi decentralized lending platforms. Aave originally launched the LEND token, which they recently transitioned to the AAVE token.
Following COMP many other DeFi applications launched governance tokens during the summer of 2020. Yearn.finance, an application that automatically invests user’s funds into the highest yielding decentralized lending markets, launched the YFI governance token in mid-July. YFI was launched through incentivized liquidity pools which has become a popular way of launching DeFi tokens. YFI reached a market cap of over $1B by the end of August.
DeFi market cap peaked on September 18th shortly after the launch of Uniswap’s UNI governance token. Uniswap, the largest Ethereum-based decentralized exchange, has been the engine behind DeFi mania. Uniswap allows anyone to create a new token pair and immediately begin trading using decentralized liquidity pools, which helped new DeFi tokens launch and scale quickly. Uniswap trading volume increased from about $1M a day in early June to close to $1B a day in the beginning of September.
UNI was launched as an airdrop that rewarded previous Uniswap users and liquidity providers. Because of its sudden launch, UNI almost immediately catapulted DeFi market cap to a new all-time high. But soon after, the bubble began to burst. New UNI recipients started to sell their tokens en masse, causing UNI’s price to drop from a high of close to $7 to a low of less than $2. Additionally, a series of exploits and hacks led to large losses, which took more air out of the sector.
Source: Coin Metrics Network Data Charts
But DeFi market cap has started to turn back around. After reaching a local low on November 4th, DeFi market cap has returned back to late September levels following a surge from BTC and ETH. If BTC and ETH continue to rise, DeFi could be a big benefactor.
Usage Rebound
Similar to market cap, DeFi usage as measured by daily active addresses also peaked in September. Following the initial airdrop there were over 176K UNI active addresses on September 17th, by far the largest amount in DeFi history. But since then UNI daily active addresses have rapidly declined and leveled off at about 5K per day.
Source: Coin Metrics Network Data Charts
Removing UNI from the above chart shows that other DeFi tokens are regaining usage. Excluding UNI, the overall number of active addresses still peaked in early September, mostly due to the rise and fall of SushiSwap (SUSHI).
Source: Coin Metrics Network Data Charts
Continue reading “The State of DeFi Tokens” here…
Network Data Insights
Summary Metrics
Source: Coin Metrics Network Data Pro
Bitcoin (BTC) and Ethereum (ETH) continued their hot streaks this week. BTC averaged over 1M daily active addresses and continues to close in on the all-time high of 1.29M set in December 2017. BTC’s realized cap topped $128B on November 12th, the highest it's ever been. ETH’s realized cap grew 3.9% week-over-week and is now over $36B, its highest level since September 2018.
Network Highlights
After originally forking from Bitcoin in August 2017, Bitcoin Cash (BCH) is undergoing its own split. On Nov 15th, Bitcoin Cash forked into two chains: BCHA, and BCHN. At time of writing, BCHN appears to be winning, as little to no hash power is being devoted to BCHA.
Initially proposed as a “medium-of-exchange” alternative to BTC that could be used as a transactional currency, BCH has averaged less than $150M per day of adjusted transfer value for most of 2020. Comparatively, BTC is currently averaging over $4B of daily adjusted transfer value.
Source: Coin Metrics Network Data Charts
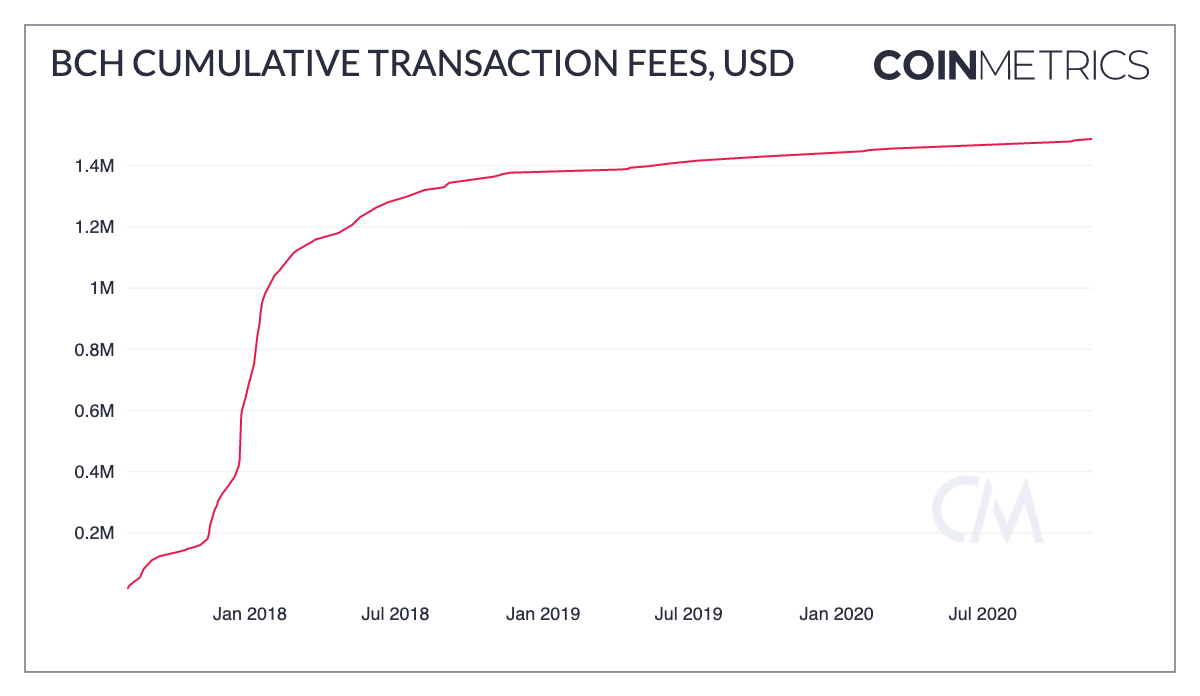
Although low transaction fees were often touted as one of the advantages of BCH, low fees likely hurt the long-term viability of the network. Transaction fees are paid to miners as an incentive for securing the network (in addition to block rewards). While low average fees are good for individual users, low total fees typically means that there’s low demand for block space, and ultimately low demand for using the network. BCH has had a total of less than $1.5M worth of transaction fees over its entire history. BTC had over $1.6M daily transaction fees last Friday.
Source: Coin Metrics Formula Builder
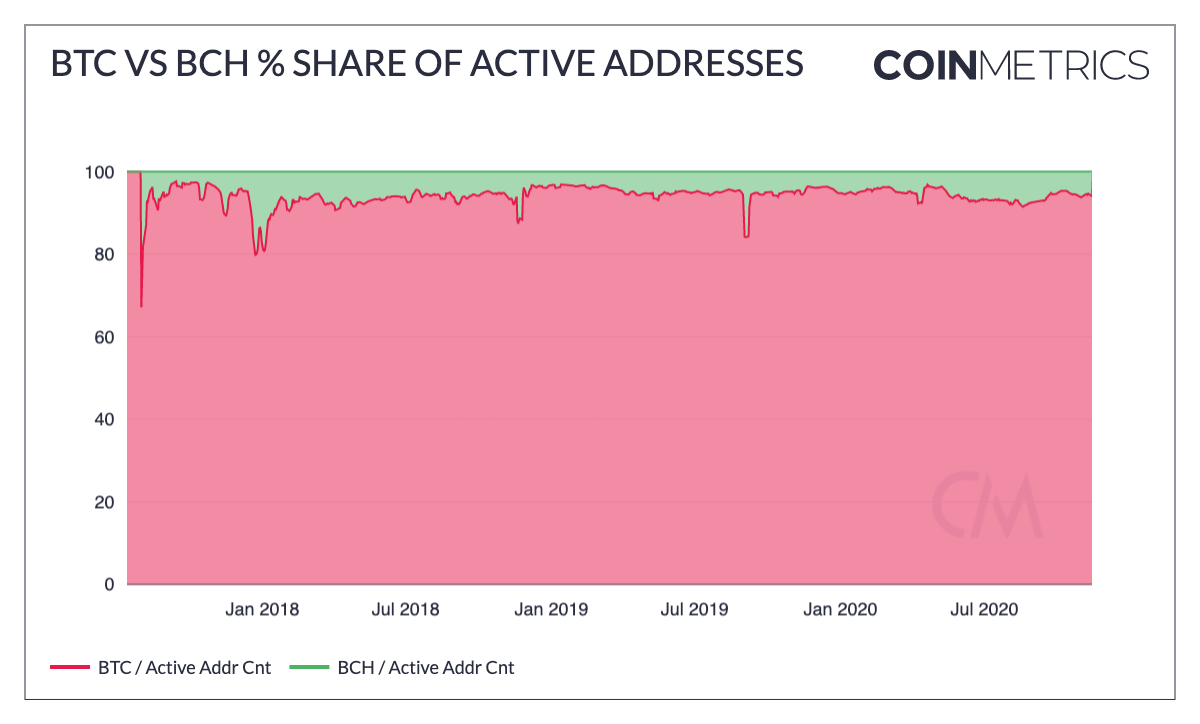
Similarly, BCH usage remains far behind BTC. The following chart shows the percent share of total active addresses across both BTC and BCH. BCH only has about 6% of active addresses, compared to 94% for BTC.
Source: Coin Metrics Network Data Charts
Market Data Insights
The decentralized exchange (DEX) tokens, UNI and SUSHI, made tremendous gains this past week as traders/speculators looked to place bets leading up to this Tuesday. November 17th marks the day that the initial UNI liquidity mining bonus program is originally scheduled to end.
For those unfamiliar, this program pays out Uniswap's governance token, UNI, at a rate of 83,333 per day to liquidity providers in the pairs ETH/USDT, ETH/USDC, ETH/DAI, and ETH/WBTC. There are two base case outlooks on the end of this program:
1) UNI will go up in value with decreased supply.
2) UNI will decrease in value because liquidity will leave Uniswap due to lowered incentives, decreasing the value of the platform.
This creates an opportunity for the similar, alternative dex SushisSwap to attempt to attract that liquidity searching for a higher yield. And as of Monday afternoon they are changing their bonus structure to do just that, boosting the incentives paid out to those pools with programs ending on Uniswap.
A governance proposal has been made for Uniswap to extend the program an additional two months while reducing the rewards by half. If voted in this proposal would not take effect until December 4, 2020, giving liquidity providers a fairly large window of time to move from the platform. The real winners from the continuation of the bonuses by both Uniswap and SushiSwap are the yield farming tokens which can continue to leverage these platforms to boost APY.
UNI is up ~17% and SUSHI ~90% since Uniswap’s ‘community’ call last Friday
CM Bletchley Indexes (CMBI) Insights
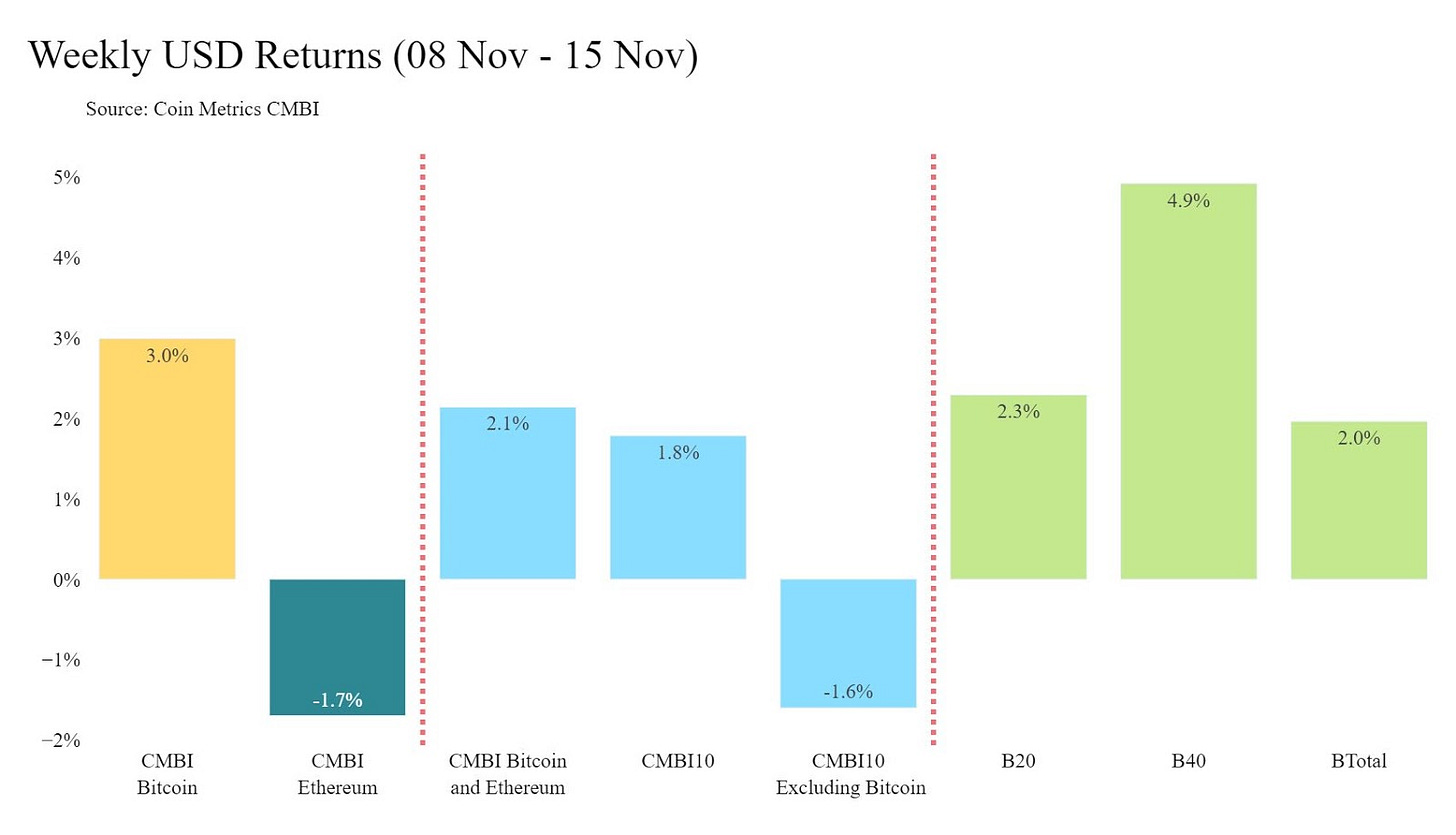
A mixed week for CMBI and Bletchley Indexes that saw a cool down in most of the large cap market after several weeks of outperformance and a slight resurgence in mid and small caps. The exception to this was the CMBI Bitcoin, which had another strong week closing up 3% at $15,860.81. During this week, Bitcoin also experienced multi year highs, reaching levels that had not been experienced since January 2018.
The CMBI Ethereum finished the week down like many of the top 10 assets, closing at $444.11. The contrast in performance between Bitcoin and the other top 10 crypto assets can be observed in the returns of the CMBI10 and the CMBI10 Excluding Bitcoin, the former which closed the week up 1.8%, the latter down 1.6%.
Coin Metrics Updates
This week’s updates from the Coin Metrics team:
We’re excited to announce the new Coin Metrics mobile app. View real-time cryptoasset pricing and relevant on-chain data in a single app! Download for free here: https://coinmetrics.io/mobile-app/
As always, if you have any feedback or requests, don’t hesitate to reach out at info@coinmetrics.io.
Subscribe and Past Issues
Coin Metrics’ State of the Network, is an unbiased, weekly view of the crypto market informed by our own network (on-chain) and market data.
If you'd like to get State of the Network in your inbox, please subscribe here. You can see previous issues of State of the Network here.
Check out the Coin Metrics Blog for more in depth research and analysis.


