Get the best data-driven crypto insights and analysis every week:
Crypto’s August Rebound
By Nate Maddrey and Kyle Waters
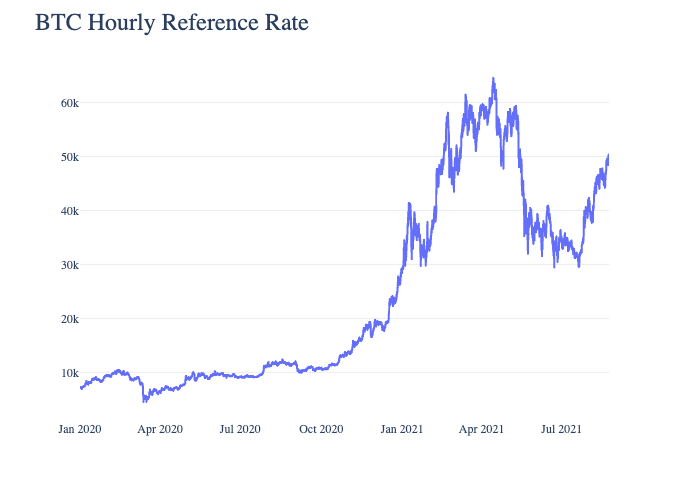
After falling as low as $29.76K in July, bitcoin (BTC) price broke back above $50K on Monday. Data suggests that BTC is on the path to recovery after a market wide crash just three months ago.
Source: Coin Metrics Reference Rates
In May, a surprise government crackdown caused Chinese miners to suddenly shut down their operations and relocate to friendlier jurisdictions. Miners and other Chinese investors sold their BTC amidst news of crackdowns on exchanges and further regulation. The ensuing panic contributed to a market wide crash that saw BTC’s price drop by over 50%.
As mining operations moved out of China Bitcoin hash rate plummeted to its lowest level since 2019. But it started to recover in July and August after hitting a local bottom on June 26th. The recovering hash rate is a signal that some mining operations are starting to come back online in new locations and that the worst of the crackdown is likely over.
Source: Coin Metrics Network Data Charts
BTC SOPR (7-day average) turned negative for most of June, a sign that investors were selling at a loss. SOPR is a ratio of bitcoin’s price at the time UTXOs are spent to its price at the time they were created. In other words, it’s a proxy for price sold divided by price paid. To learn more about how to interpret SOPR check out our On-chain Indicators Primer.
But BTC SOPR has turned positive again in August, a sign that the capitulation period has ended and that the market is back on more solid ground.
Source: Coin Metrics Network Data Charts
BTC perpetual futures open interest has started to climb back up over the last month and has returned back to May levels, although it is still below the peak reached in April.
Open interest is a measurement of the total number of active futures contracts. Increasing open interest indicates that more contracts are being opened and additional money is coming into the market. Open interest can also serve as a proxy for measuring leverage. If there’s a relatively high amount of open interest there’s a good chance there’s a high amount of leverage in the futures market, as contracts are often opened using leverage. As large liquidations occur, open interest can quickly start to decrease as the market deleverages.
On July 19th, Binance reduced their maximum amount of leverage to 20x, down from a previous max of 100x. On July 25th, FTX made a similar announcement, reducing maximum leverage to 20x. Although open interest is rising the overall amount of leverage is likely lower than seen in April and May. Lower leverage should help reduce the risks of the extreme liquidation cascades that occurred during May’s crash.
Source: Coin Metrics Market Data
The rest of the crypto market has bounced back over the past month as well. Smaller-cap assets have outperformed BTC over the last 30 days led by Cardano (ADA) and Polkadot (DOT). Other potential Ethereum competitors have broken out over the last month, including new all-time highs for Solana (SOL). ETH has outperformed BTC over the last 30 days as CryptoPunks, Art Blocks, and other Ethereum-based NFTs have caught fire.
Source: Coin Metrics Network Data Charts
Spot trading volume has begun to rebound as well. Combined trusted trading volume of BTC, ETH, XRP, BNB, DOGE, ADA, DOT, and UNI topped $25B on August 19th. But it is still well below the levels seen in April and early May - on May 9th, DOGE alone accounted for over $20B of trading volume. Retail frenzy is still relatively muted compared to earlier this year, even as prices march back towards all-time highs.
Source: Coin Metrics Network Data Charts
To follow the data used in this piece and explore our other on-chain metrics check out our free charting tool, formula builder, correlation tool, and mobile apps.
Network Data Insights
Summary Metrics
Source: Coin Metrics Network Data Pro
BTC and ETH usage continued to climb over the last week, growing 4.6% and 4.2% respectively week-over-week. Although ETH transactions increased by 3%, total fees dropped by 25.9% for an average of $16.3M a day. While ETH fees have cooled off some since last week they still remain at their highest levels since May mostly thanks to a burst of new NFT drops.
Network Highlights
The number of BTC and ETH addresses with relatively small holdings has been rising throughout 2021. The total number of BTC addresses holding between 0.001 and 0.1 bitcoin has increased ~15% so far in 2021 but has been somewhat flat since the end of April. The number of ETH addresses holding 0.01 to 1 ETH is up ~58% YTD and has continued to steadily increase throughout the summer. With NFT summer raging on Ethereum, it is possible that retail interest in NFTs is helping Ethereum adopt new users.
Source: Coin Metrics Network Data
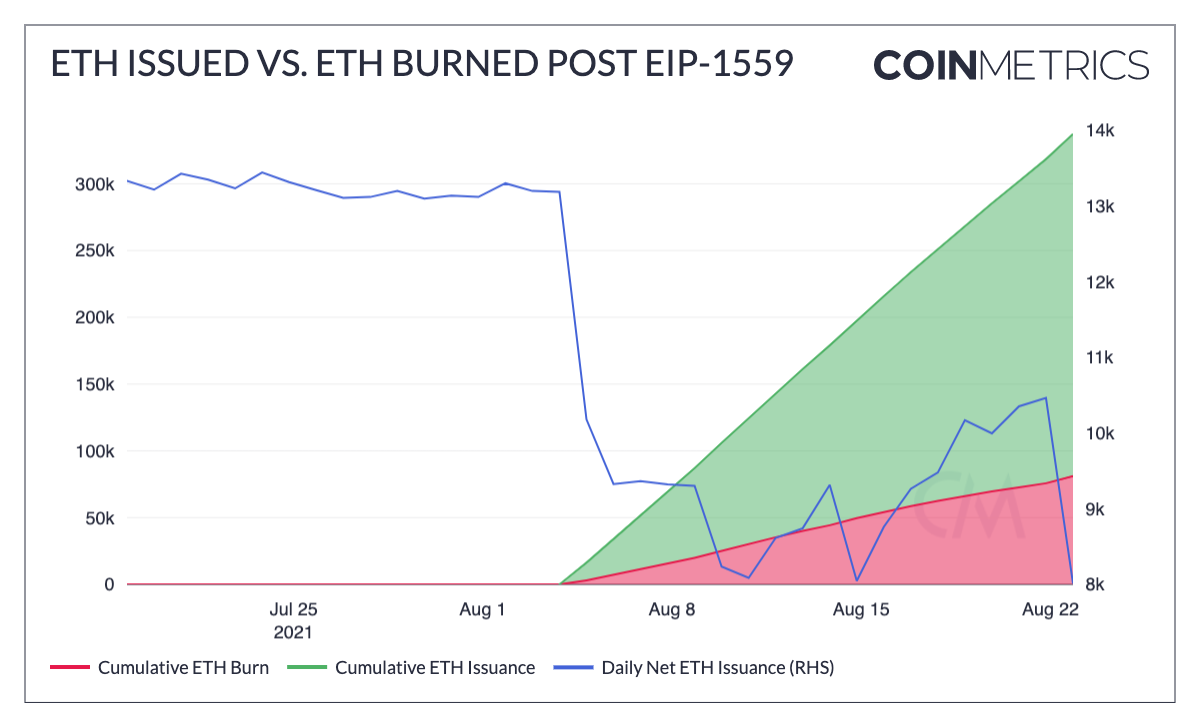
Daily net ETH issuance has fallen from an average ~13K over the week preceding EIP-1559 to averaging near 9.5K now, about a 27% decrease due to the new base fee being burnt. Altogether, roughly 32% of the cumulative ETH issued since EIP-1559 went live on August 5th has been burnt. Over 81K ETH has now been burnt to date.
Source: Coin Metrics Network Data
The percentage of Ethereum transactions using the EIP-1559 fee mechanism has been increasing as wallets catch up in supporting the new format. On August 18, MetaMask started rolling out EIP-1559 support to its users. Since this announcement, the daily percentage of transactions using EIP-1559 vs. the legacy fee mechanism has accelerated, rising from ~23% of transactions to a little over 40% on August 22nd. More transactions should be EIP-1559 compliant moving forward as more wallets implement support for the new fee mechanism.
Source: Coin Metrics Network Data
Coin Metrics Updates
This week’s updates from the Coin Metrics team:
Check out our new market-data focused newsletter State of the Market, featuring weekly updates on market conditions.
We’re excited to announce the new Coin Metrics mobile app. View real-time cryptoasset pricing and relevant on-chain data in a single app! Download for free here: https://coinmetrics.io/mobile-app/
As always, if you have any feedback or requests please let us know here.
Subscribe and Past Issues
Coin Metrics’ State of the Network, is an unbiased, weekly view of the crypto market informed by our own network (on-chain) and market data.
If you'd like to get State of the Network in your inbox, please subscribe here. You can see previous issues of State of the Network here.
Check out the Coin Metrics Blog for more in depth research and analysis.
© 2021 Coin Metrics Inc. All rights reserved. Redistribution is not permitted without consent. This newsletter does not constitute investment advice and is for informational purposes only and you should not make an investment decision on the basis of this information. The newsletter is provided “as is’ and Coin Metrics will not be liable for any loss or damage resulting from information obtained from the newsletter.


