Coin Metrics' State of the Network: Issue 161
Tuesday, June 28th, 2022
Get the best data-driven crypto insights and analysis every week:
State of the Network’s Q2 2022 Mining Data Special
By Kyle Waters, Parker Merritt, and Nate Maddrey
In last week’s State of the Network we noted that the most active Bitcoin miners have likely been moving around their coins amid increased BTC price volatility. This week, we take a closer look at mining data as a hectic quarter in the crypto markets nears its end.
Hashrate & Mining Difficulty
Hashrate provides an estimate to the total amount of computational activity that miners expend when working to add new blocks to the chain. In proof-of-work, miners compete to find the next block by taking data known as the block header (which includes information such as the previous block hash and transactions to be included in the new block) and hashing that data to find a valid solution and win the block’s rewards (6.25 BTC today) in addition to transaction fees paid by users.
In addition to being an important proxy for Bitcoin network health and security, hashrate is a macro indicator for the mining industry as a whole. Hashrate, on a 30-day moving average, has been steady despite BTC’s price action: it has hovered around 215 EH/s (quintillion hashes per second) after peaking in May at 220 EH/s.
Source: Coin Metrics’ Formula Builder
Note that there is no way to directly measure hashrate on-chain, so hashrate is inferred from the speed that new blocks are being added to the blockchain. Because of this, large day-to-day moves are often attributable to statistical noise. You can read more on how Coin Metrics calculates an implied hashrate measure from on-chain data here.
Bitcoin mining difficulty is another important metric to follow. Bitcoin’s mining difficulty is a network-determined parameter that automatically adjusts roughly every 2 weeks (2,016 Bitcoin blocks) to target a 10-minute block interval.
Bitcoin’s difficulty recently fell by 2.3%, the second largest decline of 2022.
Source: Coin Metrics’ Formula Builder
Difficulty has a direct impact on miner profitability as the average time to find a new block given a constant hashrate rises and falls with difficulty adjustments.
As we explored in our Q1 Mining Special, as mining difficulty increases, BTC-denominated revenues (and consequently, USD-denominated revenues) decrease proportionally. But mining difficulty is only one part of miner economics.
Rising Energy Costs
In addition to mining difficulty, miners must consider another important input— energy costs. As a result of rising inflation and supply chain bottlenecks, many miners are being squeezed on both sides, paying more for their energy while also earning less revenue.
The chart below shows the change in the average industrial electric rate for the top 10 states by hash rate from March 2021 to March 2022. Industrial rates in some states such as Georgia and Oklahoma have increased by more than 20% YoY.
Source: EIA & Cambridge Bitcoin Electricity Consumption Index
Despite the increases, some miners possess unique relationships with their power providers, giving them the ability to hedge against increases in their energy costs. Geographic location is ultimately one of the largest factors in determining a miner’s per kilowatt-hour power rate— and therefore, their profit margins.
In the chart below, we see the combined impact of a lower BTC price and fluctuating energy prices on miner margins. Even with the most cutting-edge mining hardware (for example, Bitmain’s Antminer S19), each machine costs as much as $1.50 more per day to operate now vs. a year ago. For industrial-scale miners with tens of thousands of ASICs, this has significant repercussions for their business’s bottom line, especially in the midst of a downmarket.
Sources: Coin Metrics Network Data Pro & EIA
Hardware Competitiveness
Another important consideration for miner competitiveness is their selection of appropriate hardware. Though the early years of Bitcoin allowed users to mine with standard CPUs and GPUs, today’s mining landscape is dominated by a specialized class of computers called ASICs (Application-Specific Integrated Circuits) that are designed for the sole purpose of mining BTC.
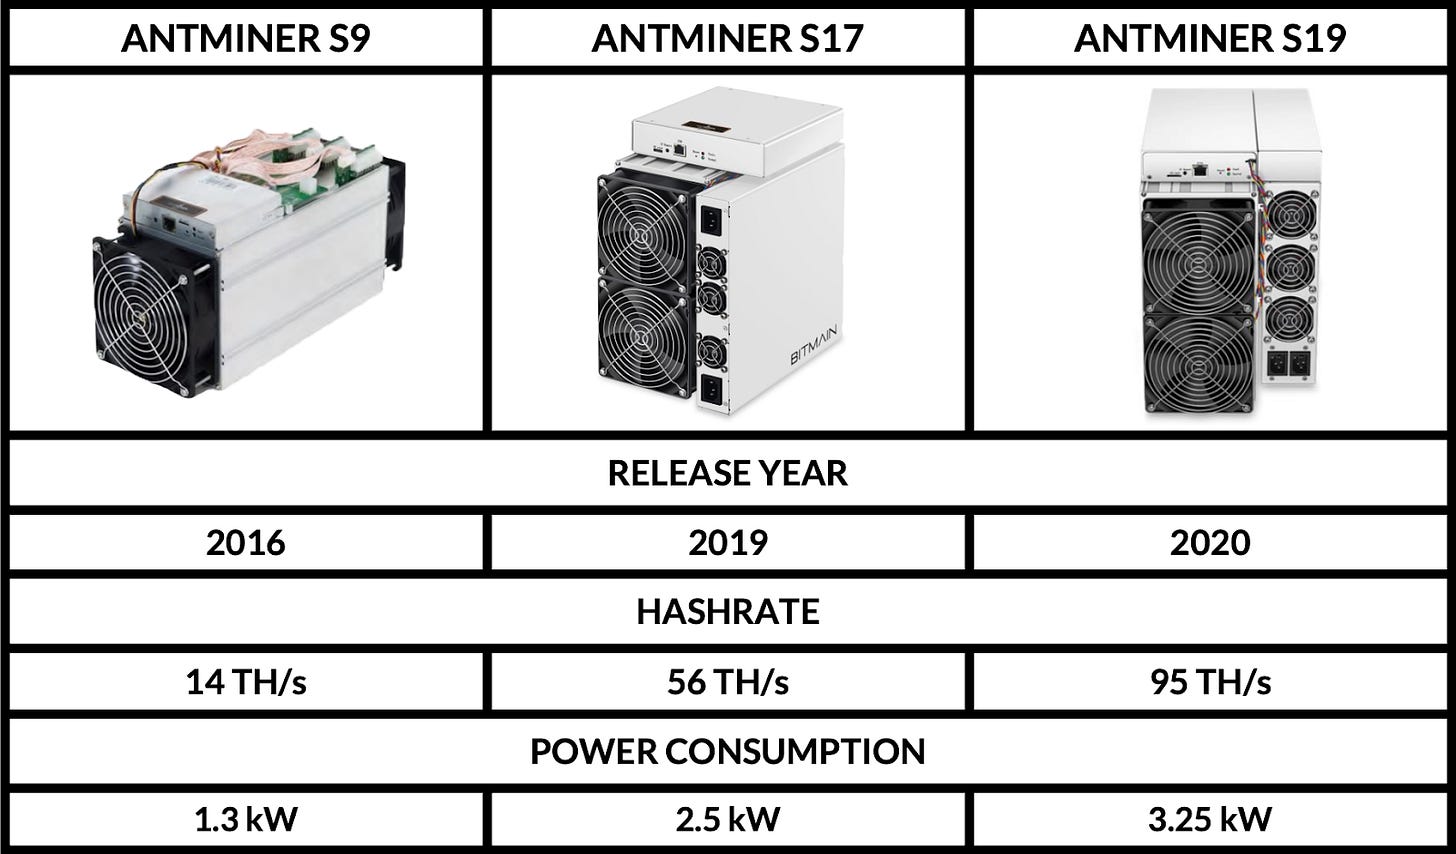
An ASIC’s profitability primarily varies based on its hashrate and power consumption. Over time more efficient ASICs have entered the market with advances in chip-making, overtaking older hardware. For example, Bitmain’s Antminer S9 was originally released in 2016, offering miners a per-unit hash rate of 14 TH/s with a power consumption of around 1300 Watts. Though the S9 was one of the most dominant ASIC models for many years, over time it was out-competed by more efficient models like the Antminer S17, and by mid-2020 it was widely considered obsolete.
As the bitcoin price began to skyrocket in 2021, however, even older models like the S9 once again reached the threshold for profitability. At the same time, newer models like the Antminer S19 began to generate enormous cash flows, incentivizing an unprecedented level of investment in the Bitcoin mining industry.
The chart below shows the estimated daily profit by ASIC model, with the S9 (green), S17 (purple), and S19 (orange) models highlighted. Other ASIC models are included in gray.
Sources: Coin Metrics Network Data Pro, EIA, & ASIC Miner Value (advertised model hashrates)
One of the most interesting observations we can make about ASIC profitability is the rapid expansion and compression of profit margins in response to changes in bitcoin price, particularly when it comes to older hardware. While older ASICs have a much lower hashrate output, they also consume less energy, meaning that USD-denominated revenues can quickly outpace operational costs during bull runs.
However, as the bitcoin price begins to decline (plotted in gray below), profit margins can collapse just as quickly. At the tail end of a bull market, older hardware becomes far less competitive— not only due to drops in BTC/USD, but also because newer hardware deployments begin to 'crowd out' models like the S9 and S17.
Sources: Coin Metrics Network Data Pro & EIA
Though the Antminer S9 has enjoyed many years of profitability, its golden age may finally be coming to an end.
Thanks to nonce analysis techniques, we’re able to fingerprint and quantify the dominance of various ASIC models with respect to their contribution to the total Bitcoin hashrate. At the peak of the 2017 bull run, the Antminer S9 commanded nearly 80% of the hashrate share, briefly earning miners as much as $50 in revenue per day.
Source: Coin Metrics’ Network Data Pro
In the years since, S9 profitability declined substantially, yet it retained a meaningful foothold at around 20-30% of network hashrate. However, as the past few months of bitcoin price action have continued to suppress mining margins, it appears the S9 may be surrendering its role as a dominant player in the mining ecosystem. Nonetheless, like any ASIC, there's no clear line where the S9 becomes obsolete— a savvy miner with low enough power costs may still manage to squeeze out a small profit.
Network Data Insights
Summary Metrics
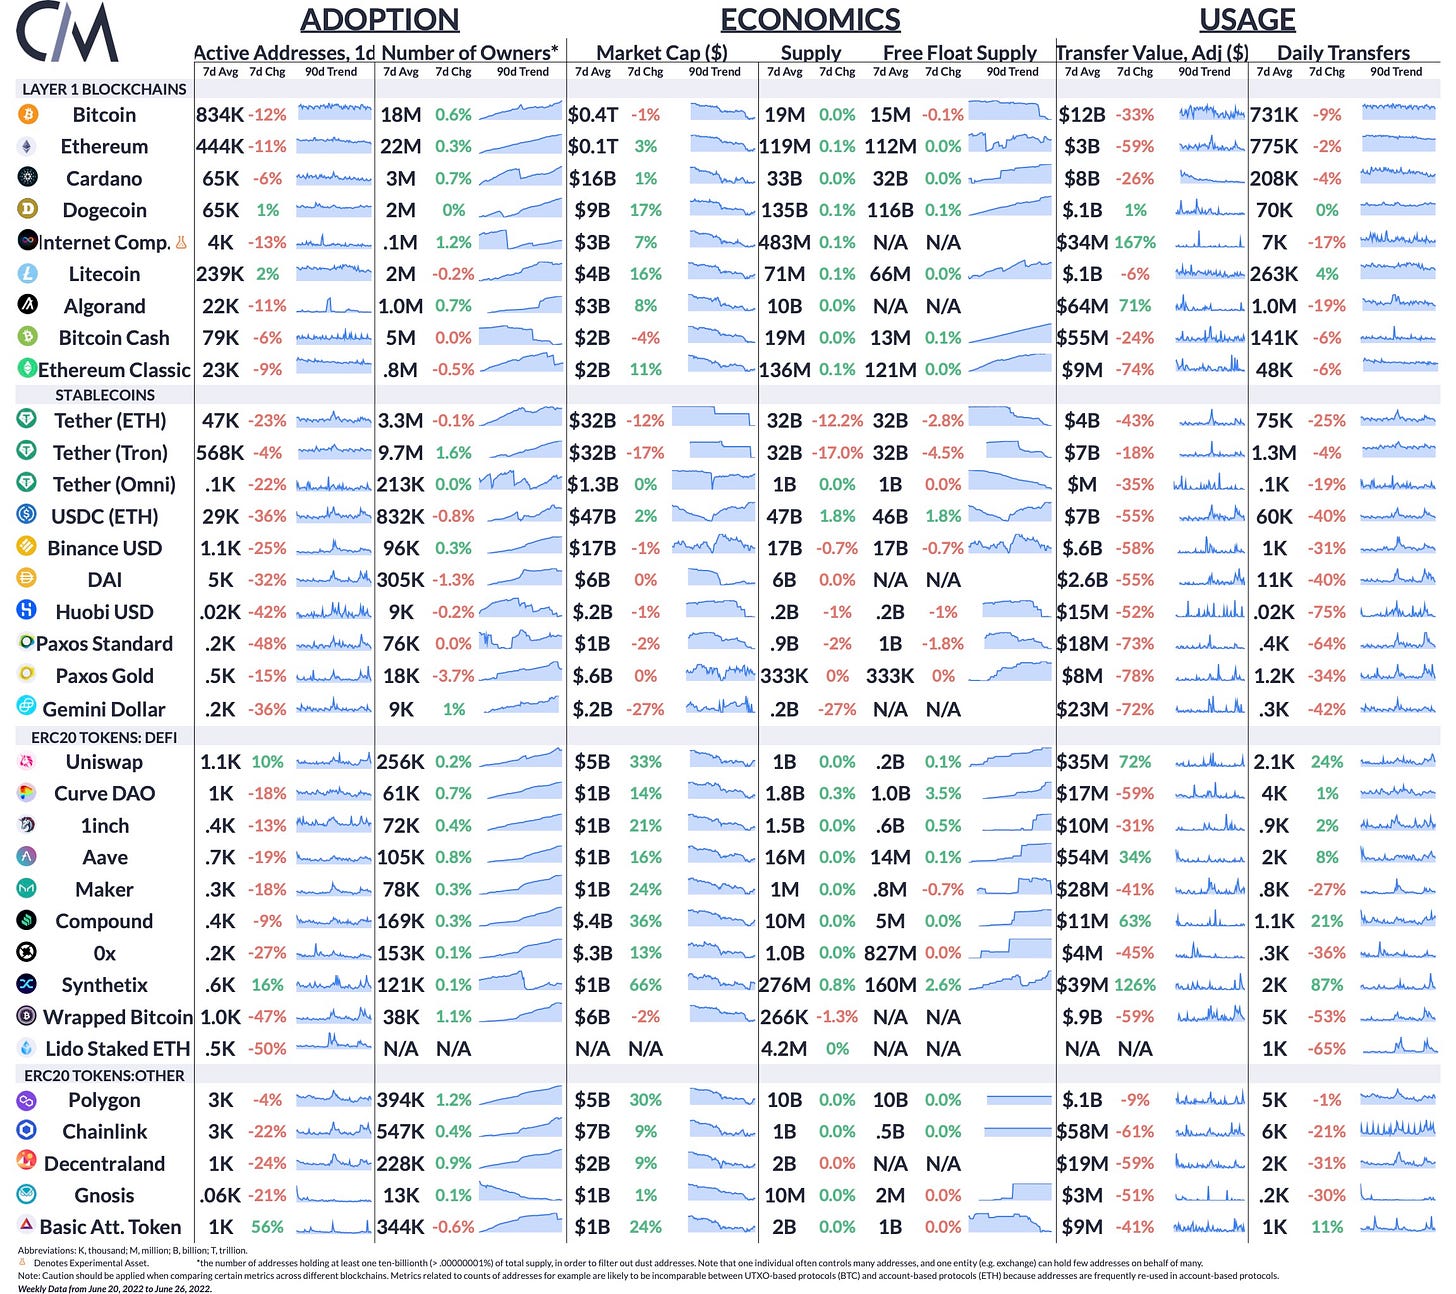
Source: Coin Metrics Network Data Pro
Bitcoin and Ethereum average daily active addresses fell over the week by 12% and 11%, respectively. Lower activity has translated into lower fees, with the average ETH transfer on Ethereum costing less than $1 over the last week. Last November a simple ETH transfer regularly could cost as much as $15. Ethereum is set to undergo a hard fork this week named Gray Glacier, which will delay the difficulty bomb back to mid-September. The fork is scheduled for block 15,050,000, which is estimated to occur this Thursday, June 30th.
Coin Metrics Updates
This week’s updates from the Coin Metrics team:
We're excited to be growing our data and research-focused community on gm.xyz, come join the conversation!
Check out our market-data focused newsletter State of the Market, featuring weekly updates on market conditions and news across the crypto ecosystem.
As always, if you have any feedback or requests please let us know here.
Subscribe and Past Issues
Coin Metrics’ State of the Network, is an unbiased, weekly view of the crypto market informed by our own network (on-chain) and market data.
If you'd like to get State of the Network in your inbox, please subscribe here. You can see previous issues of State of the Network here.
Check out the Coin Metrics Blog for more in depth research and analysis.
© 2022 Coin Metrics Inc. All rights reserved. Redistribution is not permitted without consent. This newsletter does not constitute investment advice and is for informational purposes only and you should not make an investment decision on the basis of this information. The newsletter is provided “as is” and Coin Metrics will not be liable for any loss or damage resulting from information obtained from the newsletter.


