Coin Metrics' State of the Network: Issue 174
Tuesday, September 27th, 2022
Get the best data-driven crypto insights and analysis every week:
State of the Network’s Q3–2022 Mining Data Special
By Parker Merritt, Kyle Waters, Matías Andrade, and Nate Maddrey
2022 has been a challenging year so far for crypto miners. Although it was a long time coming, The Merge marked an abrupt end to a lucrative 7-year run for Ethereum GPU miners. Meanwhile, the crypto market downturn and rising energy costs have squeezed Bitcoin miners’ profit margins. Nevertheless, the industry has continued to adapt and is still one of the most important areas of research in the digital assets space.
In this week’s State of the Network, we analyze some of the most important data points in the mining industry from Q3 2022.
Ethereum Classic: No Country for Old Miners
Ethereum miners were given their final ETH block reward under Proof-of-Work on September 15th as the network finally completed its transition to Proof-of-Stake with The Merge. Ethereum hashrate (hashrate provides an estimate of the total computational resources allocated to a PoW network) reached as high as 1,000 TH/s (trillion hashes per second) earlier this year before falling during the spring market crash. But it still had hovered around 850 TH/s leading up to The Merge. All of this hashrate had to go somewhere post-Merge, and some ETH miners moved over to Ethereum Classic (ETC), the Ethereum fork that emerged from the 2016 hack of The DAO. ETC hashrate quickly jumped to over 200 TH/s right after The Merge, or about 25% of all ETH hashrate switching over to ETC.
Source: Coin Metrics Formula Builder
But ETH miners looking for a new home are beginning to face the harsh reality that mining ETC is far from a viable alternative. ETC miners have made just $5.7M in revenue in the ten days since The Merge. For reference, before The Merge ETH miners were making over $20M each day. ETC hashrate is in decline as more miners evaluate the tough economics of mining on a chain with very little activity. The reality is that GPU miners have very few options these days other than reflecting on the halcyon days of ETH mining.
Bitcoin Hashrate Hits a New High
Bitcoin miners continue to hash away; despite the major changes elsewhere, the Bitcoin mining industry has continued its path toward institutionalization and maturation. Unlike Ethereum mining, which few publicly-traded companies participated in, publicly-traded Bitcoin miners continue to expand their operations as they take delivery on machines ordered months in advance.
This has helped push Bitcoin hashrate to a new all-time high. Measured on a 30-day moving average, BTC hashrate recently reached 225 EH/s (quintillion hashes per second) surpassing May’s peak at 220 EH/s.
Source: Coin Metrics’ Formula Builder
The increase in hashrate has translated to upward changes to Bitcoin’s mining difficulty, which is a network-determined parameter that automatically adjusts roughly every 2 weeks (2,016 Bitcoin blocks) to target a 10-minute block interval.
Due in part to the probabilistic nature of Proof-of-Work, taking the mean and averaging over a 30d period allows us to consider the underlying trends in otherwise quite noisy data. Bitcoin’s difficulty has increased in each of the last 4 intervals, the longest upward streak since early 2022.
Source: Coin Metrics’ Formula Builder
Mining difficulty has a direct impact on miner profitability. As we noted in our Q1 Mining Special, as mining difficulty increases, BTC-denominated revenues (and, consequently, USD-denominated revenues) decrease proportionally. The charts below present the difficult economics that Bitcoin miners face in today’s market conditions.
Source: Coin Metrics’ Network Data Pro
However, despite the fall in revenue per hash, highly optimized miners with low input costs can continue to turn a profit with low enough breakeven prices, likely driving the increase in hashrate even as spot prices fall.
But Q3 also surfaced latent fragility in mining infrastructure that are important to understand as the industry continues to evolve.
Poolin Goes Off the Deep End
Though the entire mining industry suffered losses in Q3, few fared worse than Beijing-based Bitcoin mining pool Poolin. Since its formation in 2017, Poolin has been a dominant force in the mining ecosystem, consistently ranking among the top 5 pools by hashrate for several years running. However, on September 5th, the pool unexpectedly notified users that they planned to "pause all withdrawals, flash trades, and internal transfers within Poolin systems," citing liquidity issues "in the midst of the dull crypto market."
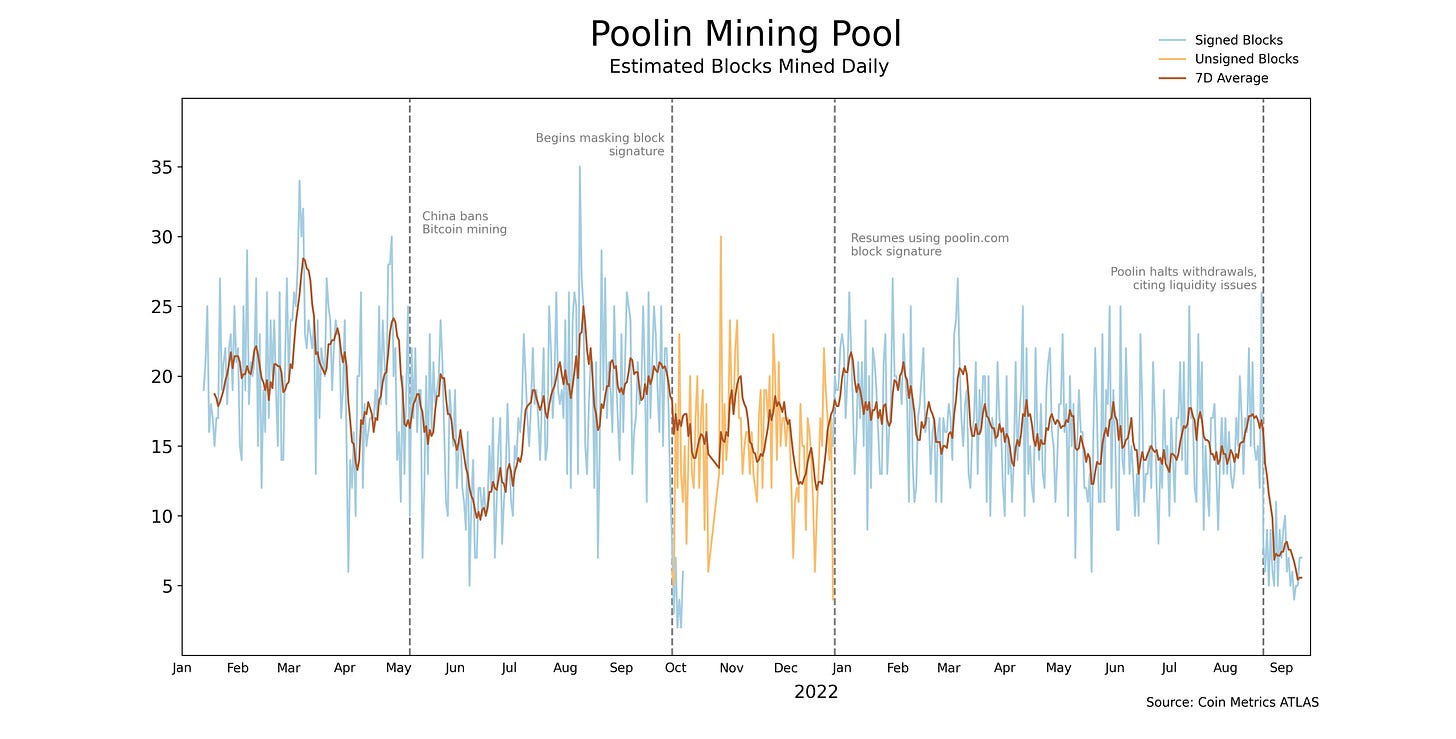
The underlying cause of the liquidity crunch remains unclear. Some speculate these issues resulted from the pool's recent foray into DeFi yield farming, while others point to problems with Poolin's mining operations in Texas. In any case, the freeze has spurred a massive exodus from the mining pool, with Poolin's estimated share of network hashrate falling by nearly 50% in a matter of days.
Just as there's no direct way to measure Bitcoin's total hashrate (which must instead be inferred from the speed at which new blocks are added to the blockchain), quantifying a single pool's hashrate share requires a combination of statistics and on-chain analysis. Luckily, many mining pools leave a subtle signature in each block's coinbase transaction (not to be confused with the popular crypto exchange by the same name). This transaction contains the miner reward—currently 6.25 BTC per block—but also leaves some extra space for arbitrary data, allowing the pool to publicly assert their claim.
Interestingly, Poolin’s coinbase signature has seen an unusual level of variation over the years. In the months following the Chinese hashrate exodus, the pool obfuscated their identity, foregoing block signatures or stamping them xxxxxx .com in place of the standard poolin.com label. While these substitutions made Poolin blocks more difficult to pinpoint over certain timeframes, the mystery signatures are linked to addresses associated with signed Poolin blocks, providing a supplementary heuristic for mapping out the pool’s dominance over time.
Given their recent liquidity issues, some observers also note that Poolin's troubles could be related to their pool payout structure. In the early days of Bitcoin mining, most pools leveraged "proportionate" payout models, distributing rewards to miners in real-time as blocks are discovered by the pool. While this model is the least risky for a pool, it can result in high variability of miner rewards, as the probabilistic nature of mining means some days will be "luckier" than others.
As the mining landscape became more competitive, however, many pools—including Poolin— embraced a newer payout structure known as Full-Pay-Per-Share (FPPS). In this model, the mining pool absorbs all risk associated with "pool luck," distributing rewards based on global averages for block rewards and transaction fees, regardless of how many blocks are actually found by the pool. In return, the mining pool charges a slightly higher fee (2.5% in Poolin’s case). While this model offers additional predictability for miners, it can also expose the mining pool to the risk of short-term imbalances between issuance and payouts, adding uncertainty to an already-volatile mining landscape.
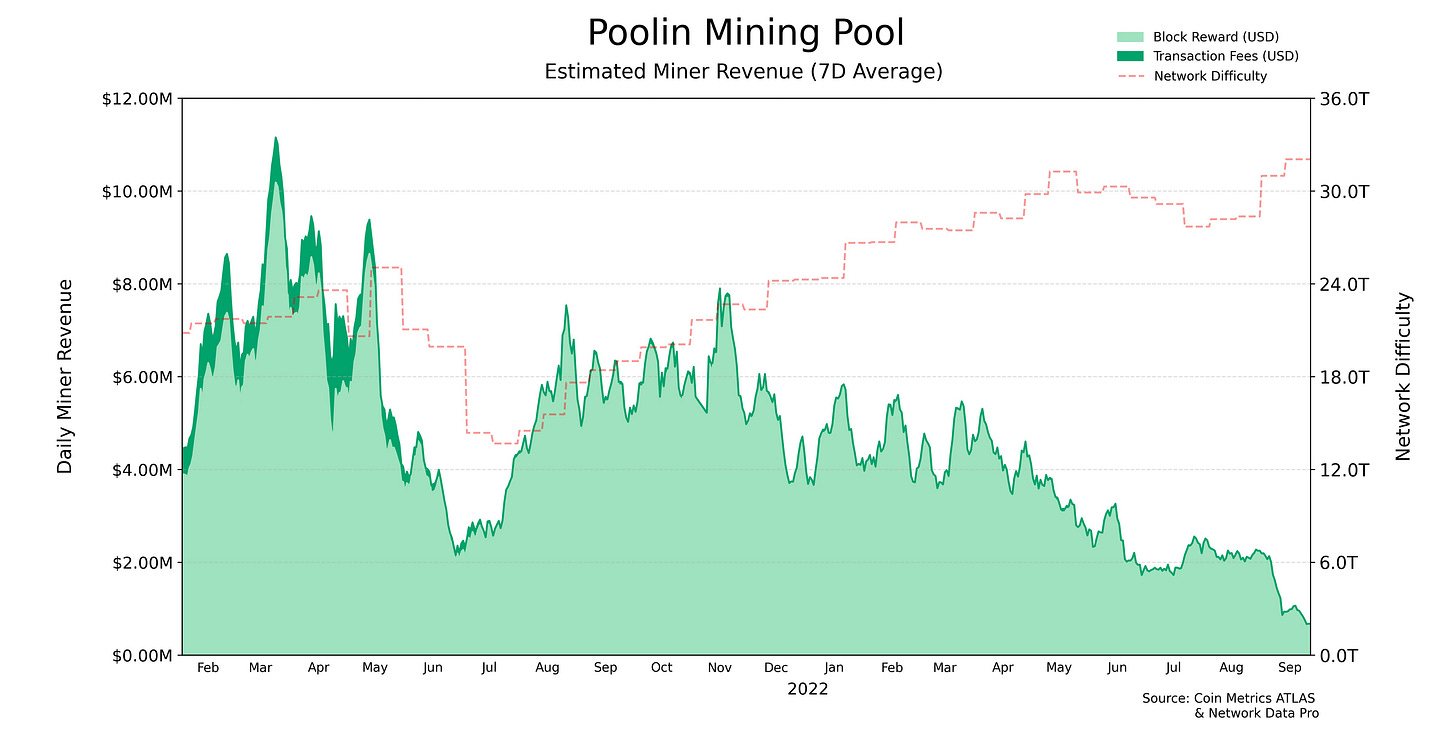
No matter the ultimate cause of Poolin's predicament, the firm now faces an existential crisis, wedged between plummeting Bitcoin prices, rising difficulty, and the mass migration of their mining community. In the heat of the 2021 bull run, the pool raked in as much as $11M per day in total miner revenue. Today, Poolin is struggling to muster 1/10th of that amount, surrendering market share to more well-capitalized competitors.
Source: Coin Metrics’ ATLAS & Network Data Pro
While more details regarding Poolin's failures in risk management are bound to surface, above all else the episode speaks to the cutthroat nature of the mining pool business. At the slightest hint of trouble, stakeholders can easily redirect their mining power to a competing pool, enforcing discipline and transparency via a ruthless hashrate democracy.
To follow the data used in this piece and explore our other on-chain metrics check out our free charting tool, formula builder, correlation tool, and mobile apps.
Network Data Insights
Summary Metrics
Source: Coin Metrics Network Data Pro
As excitement over Ethereum’s successful transition to Proof-of-Stake dies down, activity on Ethereum and Lido’s stETH staking derivatives fell as well, with active addresses falling by 16% and 12% respectively. Bitcoin’s active address count decreased by 5% in the same period.
Coin Metrics Updates
This week’s updates from the Coin Metrics team:
We're excited to be growing our data and research-focused community on gm.xyz, come join the conversation!
Check out our market-data focused newsletter State of the Market, featuring weekly updates on market conditions and news across the crypto ecosystem.
As always, if you have any feedback or requests please let us know here.
Subscribe and Past Issues
Coin Metrics’ State of the Network, is an unbiased, weekly view of the crypto market informed by our own network (on-chain) and market data.
If you'd like to get State of the Network in your inbox, please subscribe here. You can see previous issues of State of the Network here.
Check out the Coin Metrics Blog for more in depth research and analysis.
© 2022 Coin Metrics Inc. All rights reserved. Redistribution is not permitted without consent. This newsletter does not constitute investment advice and is for informational purposes only and you should not make an investment decision on the basis of this information. The newsletter is provided “as is” and Coin Metrics will not be liable for any loss or damage resulting from information obtained from the newsletter.


