State of Stablecoins: Signs of Returning Liquidity
Coin Metrics’ State of the Network: Issue 236
Get the best data-driven crypto insights and analysis every week:
State of Stablecoins: Signs of Returning Liquidity
By: Tanay Ved
Introduction
Stablecoins have emerged as a crucial pillar within the dynamically evolving digital asset ecosystem. Serving as a stable store of value, they bring resilience amidst tides of volatility, providing stability and utility not only in mature markets but also emerging economies grappling with high inflation and barriers to accessing financial infrastructure. The borderless and around-the-clock nature of stablecoins enable seamless cross-border transactions and remittances, making them an instrumental medium of exchange. Beyond these functions, stablecoins also act as a vital bridge to the decentralized finance (DeFi) and traditional financial economy, underpinning trading and lending operations and serving as a barometer for activity on public blockchains.
This unique value proposition has propelled the rise of the digital dollars market, peaking at $155 billion in market capitalization in 2022 before declining to $112 billion, a reflection of various challenges that have tempered growth. However, with recent uplifts in digital asset valuations, there's been a noticeable resurgence in stablecoin supply, suggesting a potential revival of on-chain liquidity and the demand for stablecoins in both falling and rising markets.
In this issue of Coin Metrics’ State of the Network, we take a closer look at stablecoin supply, usage and adoption, as well as emerging trends shaping the landscape as we potentially transition into a different market regime.
Market Cap & Supply Trends
The market capitalization of the asset class today primarily comprises USDT and USDC, which make up the lion's share of total supply. The recent rise has been fuelled by the growth of Tether (USDT) on the Ethereum ($41 billion) and Tron ($48 billion) networks respectively, resulting in an all time high market cap of $88 billion for Tether, as Circle’s USDC stabilizes at $22.5 billion. Despite the dominance of fiat-collateralized stablecoins, the growth of stablecoins collateralized by crypto-assets (i.e, ETH) and off-chain assets (i.e, public securities) underscores the growing diversity and adaptability of the asset class.
Source: Coin Metrics Network Data
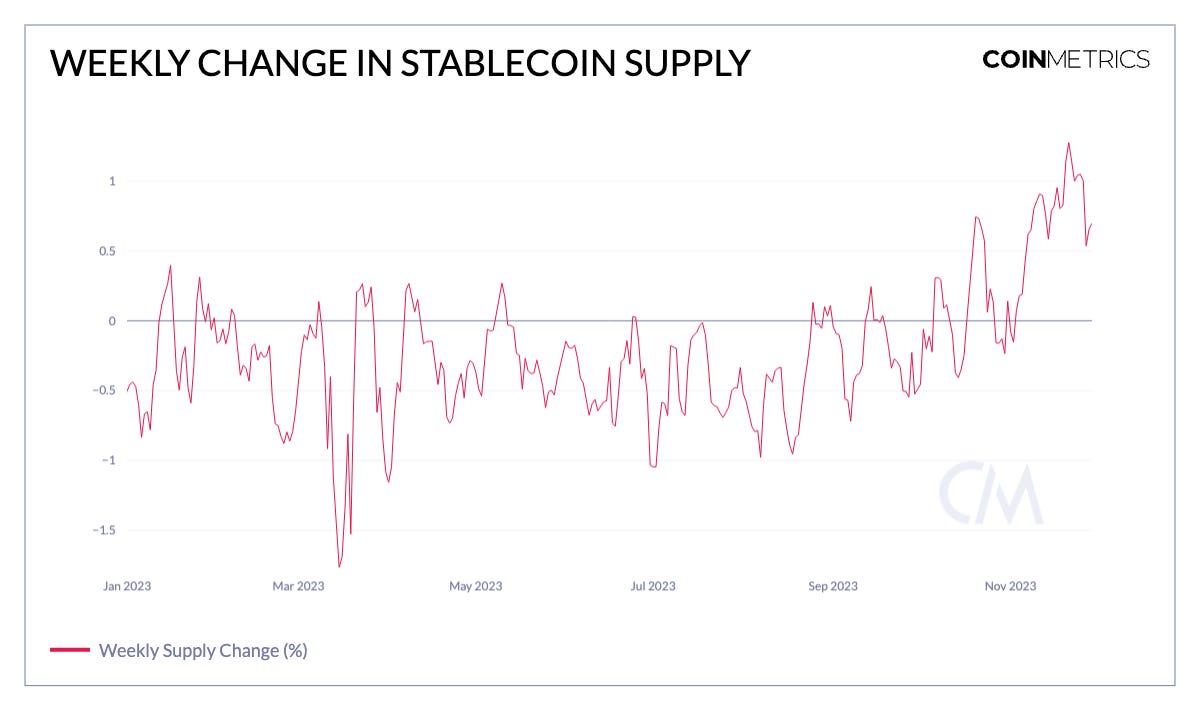
This is reflected in the chart below, which illustrates weekly changes in stablecoin supply over the year. In the aftermath of significant events like the Luna collapse in June 2022, and the Silicon Valley Bank (SVB) crisis in March, we observed a notable decline in total stablecoin supply, indicative of wavering market confidence. However, since October 2023, the aggregate stablecoin supply has trended upwards, marking a shift towards positive growth. This upward trend can be interpreted as a leading indicator of improving liquidity on-chain, suggesting an environment where more capital is available for deployment.
Source: Coin Metrics Network Data
To understand where the increase in stablecoin supply is going, a closer examination of supply held by smart contracts is revealing. For instance, USDC, a popular asset in decentralized finance (DeFi) applications had a significant portion of its supply in smart contracts, peaking over $20 billion in March 2022. However, over the year, this figure has seen a contraction, halving from its high of $14 billion in March to $7 billion as of December 2023. In contrast, Tether (ETH), predominantly held in externally-owned accounts (EOA’s), has witnessed a different trend. Its presence in smart contracts has grown, rising from $4 billion at the start of this year to over $6 billion.
Source: Coin Metrics Network Data
Adoption Trends
Source: Coin Metrics Network Data
Transitioning from supply in smart contracts, we shift our focus to broader stablecoin adoption trends, as reflected by the number of accounts with substantial holdings. While the number of addresses holding greater than $100k USDC has declined to 13k addresses, and those for USDT on Ethereum remain relatively stable, a different story unfolds for USDT on the Tron network. Tether on Tron has experienced a consistent growth in adoption, with nearly 40k addresses holding greater than $100k. This can be attributed to its lower transaction fees and potentially increasing use in emerging economies across parts of Latin America, Africa, and Asia. In these regions, where populations often face high inflation and barriers to accessing dollar-denominated financial services, easy and cost-effective access to dollars through stablecoins have become particularly desirable.
Rising Usage in Lending & Trading Markets
Stablecoins also play a crucial role in decentralized finance (DeFi). Within DeFi lending markets, these assets serve as a form of stable collateral, enabling users to earn interest on their digital asset holdings. The chart above shows utilization rates for major stablecoins on Aave, shedding light on the proportion of deposited funds being borrowed on the platform. In other words, the utilization rate is a barometer for the demand for stablecoins and capital availability in pools, with applications like Aave and Compound serving as a crucial proxy for overall activity.
There also exists a crucial relationship between pool utilization and interest rates: when a pool has ample capital but low borrowing demand (i.e, low utilization) interest rates are lowered to attract borrowers. Conversely, when liquidity in a pool is scarce (i.e, high utilization), interest rates rise to incentivize debt repayments and new deposits. Outside of the dislocation seen in March 2023, utilization rates for USDT, USDC & Dai have climbed to levels last seen in 2021—an indication of increased demand for stablecoin collateralized loans and a rising appetite for leveraging these assets for yield generation strategies.
Stablecoin spot trading volumes have seen a notable uptick, underscoring their utility as a quote asset on both centralized and decentralized exchanges. This stems from their ability to provide a stable reference point for valuing other assets, making them a popular medium for entering and exiting positions.
As seen in the chart above, trusted spot volumes have been dominated by USDT, reaching $18.8 billion on November 15th. Notably, these volumes are second only to those witnessed during major market events such as the Luna, FTX and Silicon Valley Bank collapse. USDC volumes have also risen lately, reaching $2.5 billion in November—marking an all-time high in USDC trading volume. Conversely, volume for other stablecoins have seen a downfall, driven predominantly by the reduction in BUSD volumes, which Binance announced it will end support for this month. Overall, the rising trend in volume reflects an increasing appetite amongst traders and investors to gain exposure to crypto assets with potential for appreciation, particularly as the broader crypto markets are on the rise.
Emerging Trends in Stablecoin Markets
Having grasped the current state of the stablecoin landscape, we can zoom out to understand overarching trends shaping stablecoins. Amongst this, yields offered through both on-chain and off-chain sources are an important piece of the puzzle as they impact flows of capital and also help determine avenues that may attract capital under varying economic conditions.
A major theme over the last two years has been the rise in US Treasury yields amid the cycle of financial tightening. The existence of a high yield on the “risk-free rate” has presented an opportunity cost for stablecoin holders and issuers alike, fueling capital rotation out of on-chain markets. This demand for yield and interest rate sensitivity has therefore been serviced by the rise in tokenized treasuries and interest-bearing stablecoins.
Source: Coin Metrics Labs & US Department of the Treasury
Maple Finance’s USDC Cash Management Pool serves as an example of a growing trend to enable yield-bearing products in DeFi. The pool provides access to yield sourced from US Treasury bills and targets a net APY of the Secured Overnight Financing Rate (SOFR) enabling accredited investors to deposit USDC. Since its inception, the pool has seen substantial activity, receiving a cumulative of $75 million USDC and amassing $15 million in capital.
The popularity of this trend is also evidenced in the diversification of the collateral bases for stablecoin products such as MakerDAO’s Dai into real-world assets (RWA’s) like public securities. However, the growth of stablecoin supply rates on applications like Aave may offer another alternative for stablecoin holders to productively park their assets, potentially fueling a capital rotation into DeFi applications and products collateralized primarily by on-chain assets.
Conclusion
The expanding supply of stablecoins serves as a clear indicator of rising activity and usage within the digital asset ecosystem. This is particularly evident in the supply and adoption trends examined, with Tether on Tron leading the charge. Despite challenges in the regulatory environment in the United States and a complex political landscape, stablecoin liquidity has shown impressive resilience. This expansion showcases the wide utility of stablecoins, through avenues such as DeFi pools to exchanges and even in diverse yield generating opportunities. Amid a broader market rally, these trends not only underscore growing usage, but also evidence the central role stablecoins play in the crypto-economy.
Our entire catalog of stablecoin research can be found here: https://coinmetrics.io/tag/stablecoins/
Network Data Insights
Summary Metrics
Source: Coin Metrics Network Data Pro
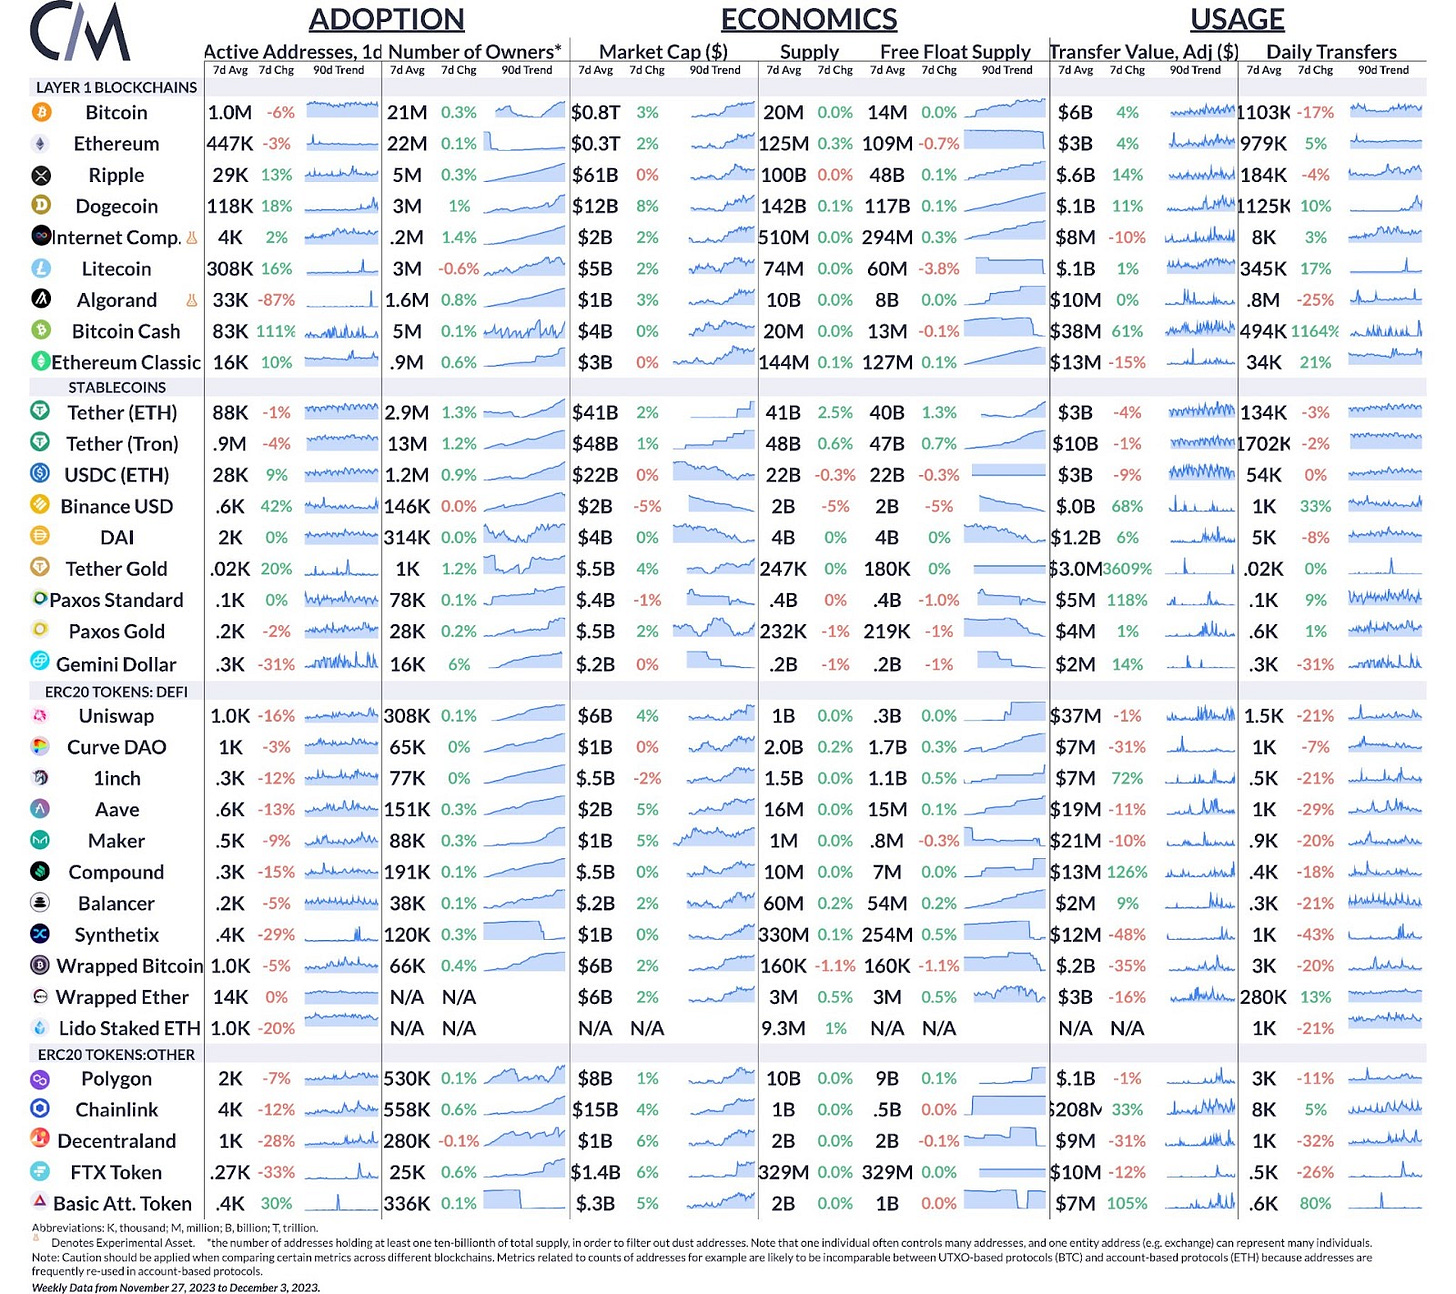
Despite a market rally, Bitcoin and Ethereum active addresses both fell by 6% and 3% respectively over the week. As explored above, stablecoin activity continues to heat up with USDC active addresses rising 9%. Forked chains Litecoin, Bitcoin Cash, and Ethereum Classic all had spikes in activity, following the broader rally across the digital assets market.
Coin Metrics Updates
This week’s updates from the Coin Metrics team:
Follow Coin Metrics’ State of the Market newsletter which contextualizes the week’s crypto market movements with concise commentary from the Coin Metrics team, rich visuals, and timely data.
As always, if you have any feedback or requests please let us know here.
Subscribe and Past Issues
Coin Metrics’ State of the Network, is an unbiased, weekly view of the crypto market informed by our own network (on-chain) and market data.
If you'd like to get State of the Network in your inbox, please subscribe here. You can see previous issues of State of the Network here.


