Coin Metrics' State of the Network: Issue 130
Tuesday, November 23rd, 2021
Get the best data-driven crypto insights and analysis every week:
Do Ethereum Gas Fees Vary by Time and Day of Week?
By Kyle Waters and Nate Maddrey
With network activity rising and ETH’s price above $4K, twenty-two days into November there has yet to be a day with sub-$30 mean transaction fee on Ethereum. With fees on the rise some users might be wondering if it makes sense to delay time insensitive transactions. Just as flights at 5am are generally cheaper than at noon, should Ethereum users expect to pay less on off hours? Examining the data on Ethereum’s base fee on a block-by-block basis suggests there might be some merit to setting an early weekend alarm in the US, or pre-scheduling transactions.
Post EIP-1559, Ethereum’s transaction fee mechanism includes a fixed-per-block network fee called a base fee that must be paid to be included in a block. The base fee fluctuates with demand for block space, moving up or down by a maximum 12.5% block-to-block based on the capacity of the previous block. During times of higher network traffic, demand for block space more often outstrips supply, leading to higher base fees.
Despite Ethereum being a 24/7, 365 network that is accessible globally, since EIP-1559’s launch in August base fees have tended to be higher during US business hours. The chart below shows the average base fee (measured in GWEI) by minute and day of week, in New York/Eastern Time. Brighter yellows represent higher typical base fees while darker blues represent lower average base fees (Note that this analysis only considers base fees while Ethereum users now tend to also pay a priority fee or miner tip to incentivize a tx’s inclusion in a block).
Source: Coin Metrics Network Data Pro
Interestingly, the morning period of midnight to 8am ET tends to have cheaper base fees vs. US business hours (9am-5pm). Additionally, weekends have been associated with lower fees, with the period of Sunday morning being especially quiet with the base fee less than 50% vs. the average during noon ET on a Wednesday.
This pattern is also apparent looking at a median, rather than mean for each minute and day of week.
Source: Coin Metrics Network Data Pro
Time-sensitive activity might be a driver of higher traffic. One such type of activity might be trading on decentralized exchanges, as traders react to new economic information and other signals. However, there isn't much of a pattern looking at the distribution of Uniswap (v2/v3) trades.
Source: Coin Metrics Network Data Pro
Another recent source of network activity has been NFTs. Sales on OpenSea have tended to be during US working hours but if anything, are more clustered on the weekend.
Source: Coin Metrics Network Data Pro
Stablecoins might be another culprit. Tether and USDC usage, for example, is increasingly concentrated during US business hours.
Regardless of the cause, this might present an interesting opportunity for scheduling non-time sensitive transactions. There are already solutions to automate smart contract executions and adoption of such protocols might help smooth out network traffic.
Crypto Markets Wobble as Macroeconomic Conditions Fluctuate
After breaking past all-time highs earlier this month, bitcoin and many of the largest crypto assets have retreated a bit amid a market shakeout. There are a few potential factors at play including a shifting macro outlook and crypto market conditions.
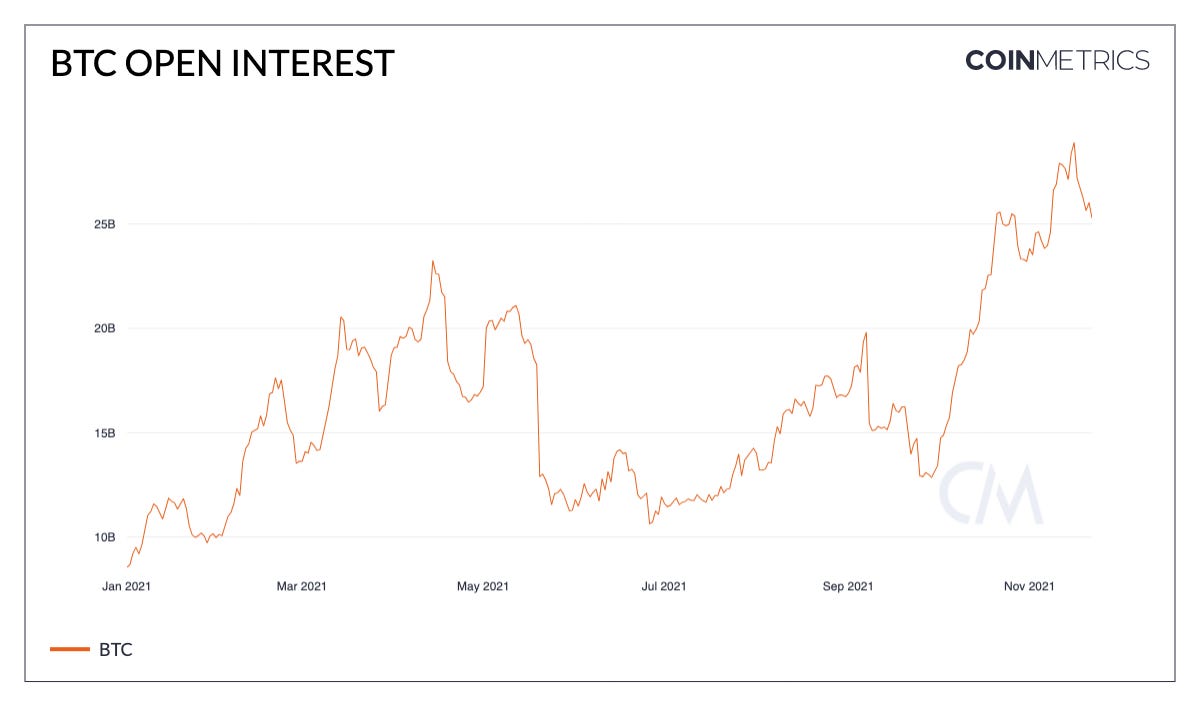
Regarding the latter, for the last couple of months open interest for BTC and ETH have been steadily increasing with open interest reaching fresh highs for both BTC and ETH last week. Open interest measures the total number of active futures contracts and an increase in open interest implies more contracts being opened while signaling additional money entering the market.
Source: Coin Metrics' Formula Builder
Open interest often serves as a good proxy for leverage (borrowing to increase exposure) as many contracts are usually opened using leverage. Part of the growth in BTC’s open interest can be explained by the launch of BTC CME futures-based ETFs, though it is likely leverage picked up amidst the bullish sentiment around the ETF launch. Higher leverage in the market means that small price movements can amplify volatility and lead to liquidations of leveraged futures. As prices have moved downward in the last week, open interest has started to decrease as pressure is placed on existing long positions.
Short-term market pressure might be rising due to changing macroeconomic conditions. US bond yields, especially treasuries with shorter-duration maturities, have been rising sharply over the last few weeks. The yield on the 2-year note has risen from 0.24% on 9/22 to near 0.60% today, as expectations for possible interest-rate hikes increase. The nomination of Fed Chair Jerome Powell for a second term has also jolted yields higher. Because crypto assets, like high-growth tech stocks, are generally perceived as riskier assets, a higher “risk-free” rate of return might reshuffle capital in financial markets.
However, inflation continues to surge and BTC’s price is reacting to new inflation information coming out of the US. Even though BTC’s price has broken a recent upward trend, teams continue to build on, including Square’s decentralized bitcoin exchange which recently released its white paper.
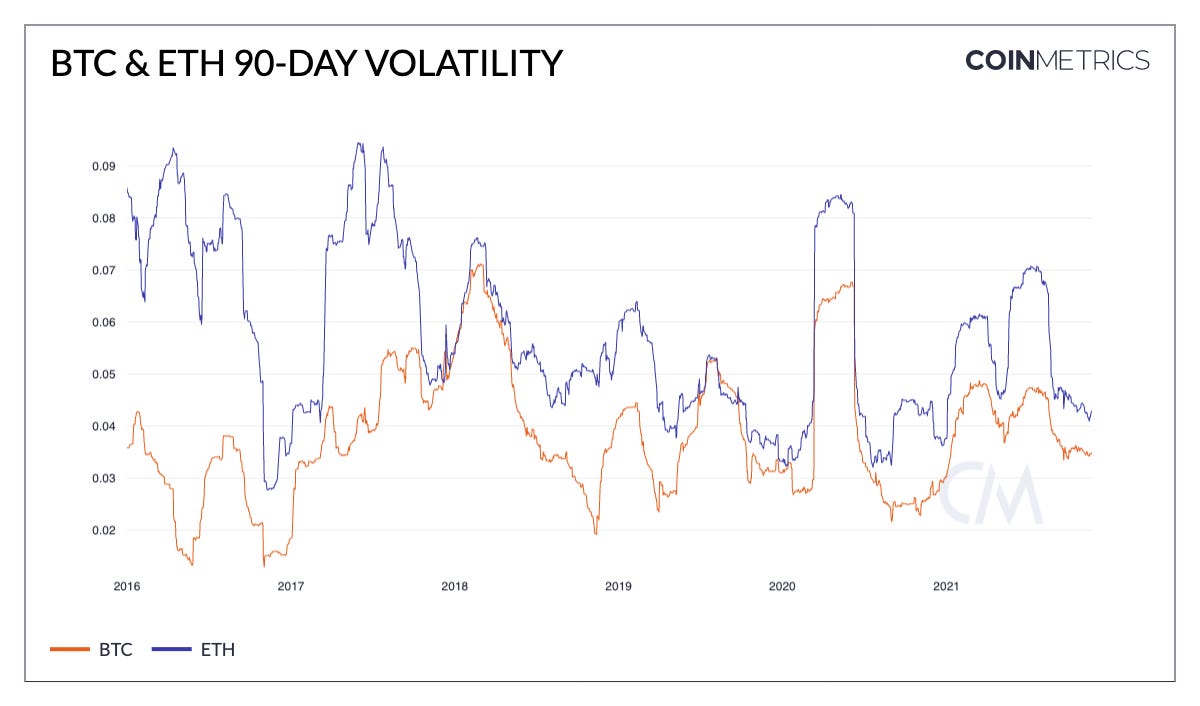
Although markets might appear turbulent, volatility (using daily log returns on a 90-day rolling window) is relatively low for BTC and ETH on a historical basis, and far from highs measured earlier this year.
Source: Coin Metrics’ Formula Builder
Bitcoin’s Taproot Upgrade Goes Live
On November 14th Bitcoin’s Taproot upgrade officially activated at block 709,632. Taproot introduces new scripting possibilities and lays the foundation for new smart contract functionality, while improving Bitcoin’s security and privacy. Among other upgrades, Taproot introduces a technique called “key aggregation” which allows multi-sig transactions and smart contract interactions to commit the same amount of data as regular transactions, helping save on space for complex transactions. Taproot also increases Bitcoin’s maximum script size, paving the way for more complex smart contracts. For a deep-dive into Taproot’s technical updates see Taproot: Explaining Bitcoin’s Biggest Upgrade in Four Years.
So far a little over 20 BTC has been stored in Taproot P2TR outputs. To track Taproot activity see txstats.io.
Source: txstats.io
To follow the data used in this piece and explore our other on-chain metrics check out our free charting tool, formula builder, correlation tool, and mobile apps.
Network Data Insights
Summary Metrics
Source: Coin Metrics Network Data Pro
On-chain transfer value increased for both BTC and ETH this past week, despite a decline in market cap for both assets. BTC averaged $20.5B in daily adjusted transfer value over the last week compared to $11.2B for ETH. However, the number of transfers for both assets declined week-over-week, signaling an increase in average transfer size. Meanwhile, stablecoin activity continued to grow, with a 1.6% increase in the number of Tether (USDT) transfers and 8.0% increase in USDC transfers. But unlike BTC and ETH, USDT adjusted transfer value dropped by 15.5% week-over-week as average transfer size dipped.
Network Highlights
This week’s video update features an updated look at the NFT market on Ethereum which appears to be rebounding after a recent drop in activity.

Coin Metrics Updates
This week’s updates from the Coin Metrics team:
Check out our market-data focused newsletter State of the Market, featuring weekly updates on market conditions.
Also check out the Coin Metrics mobile app. View real-time cryptoasset pricing and relevant on-chain data in a single app! Download for free here: https://coinmetrics.io/mobile-app/
As always, if you have any feedback or requests please let us know here.
Subscribe and Past Issues
Coin Metrics’ State of the Network, is an unbiased, weekly view of the crypto market informed by our own network (on-chain) and market data.
If you'd like to get State of the Network in your inbox, please subscribe here. You can see previous issues of State of the Network here.
Check out the Coin Metrics Blog for more in depth research and analysis.
© 2021 Coin Metrics Inc. All rights reserved. Redistribution is not permitted without consent. This newsletter does not constitute investment advice and is for informational purposes only and you should not make an investment decision on the basis of this information. The newsletter is provided “as is’ and Coin Metrics will not be liable for any loss or damage resulting from information obtained from the newsletter.


