Coin Metrics' State of the Network: Issue 162
Wednesday, July 6th, 2022
Get the best data-driven crypto insights and analysis every week:
The State of the Network Q2 2022 Wrap-Up
By Kyle Waters and Nate Maddrey
In this special edition of State of the Network we recap an eventful quarter in the crypto markets with a data-driven look at the biggest storylines of Q2, 2022.
Crypto Assets Unable to Escape Gravity of Global Financial Markets
Heading into 2022, data on crypto assets’ returns showed that the asset class was increasingly following equities, with the correlation between bitcoin (BTC) and S&P 500 growing ever tighter throughout the second half of 2021.
Historically, BTC and the S&P 500 have been fairly uncorrelated, which is a desirable trait for portfolio construction and BTC’s possible emergence as a safe haven asset. But this relationship changed dramatically after March, 2020. After briefly decreasing in 2021 BTC’s correlation to the large cap U.S. equities index has increased throughout 2022. The correlation hit a new all-time high in Q2 ‘22 with BTC and U.S. equities moving almost lock-step. At the same time BTC moved increasingly against risk indices like the VIX.
Source: Coin Metrics’ Formula Builder
With a quickly changing macro backdrop, almost all asset classes sank as financial market participants reacted to monetary policy makers' new commitments to interest rate hikes intended to tame soaring inflation. With inflation in the US hitting an annualized 8.6% in May – the largest YoY increase since December 1981 – the Federal Reserve moved in June to raise the federal funds rate by 0.75%.
With the uncertainty of inflation and higher interest rates looming, BTC and ETH fell alongside high-flying tech stocks. Gold, and even bonds suffered as well (bond prices move inversely to rates).
Sources: Coin Metrics Reference Rates & Google Finance
Zooming into the crypto markets, all major assets fell throughout the quarter with many of the top assets falling by more than a quarter in June alone.
Source: Coin Metrics Reference Rates
(Note: LUNA technically did not drop a full 100% in May, but dropped over 99.99%)
With volatility accelerating sharply across financial markets throughout the quarter, all corners of the crypto markets were set to be tested.
Stablecoin Scrutiny
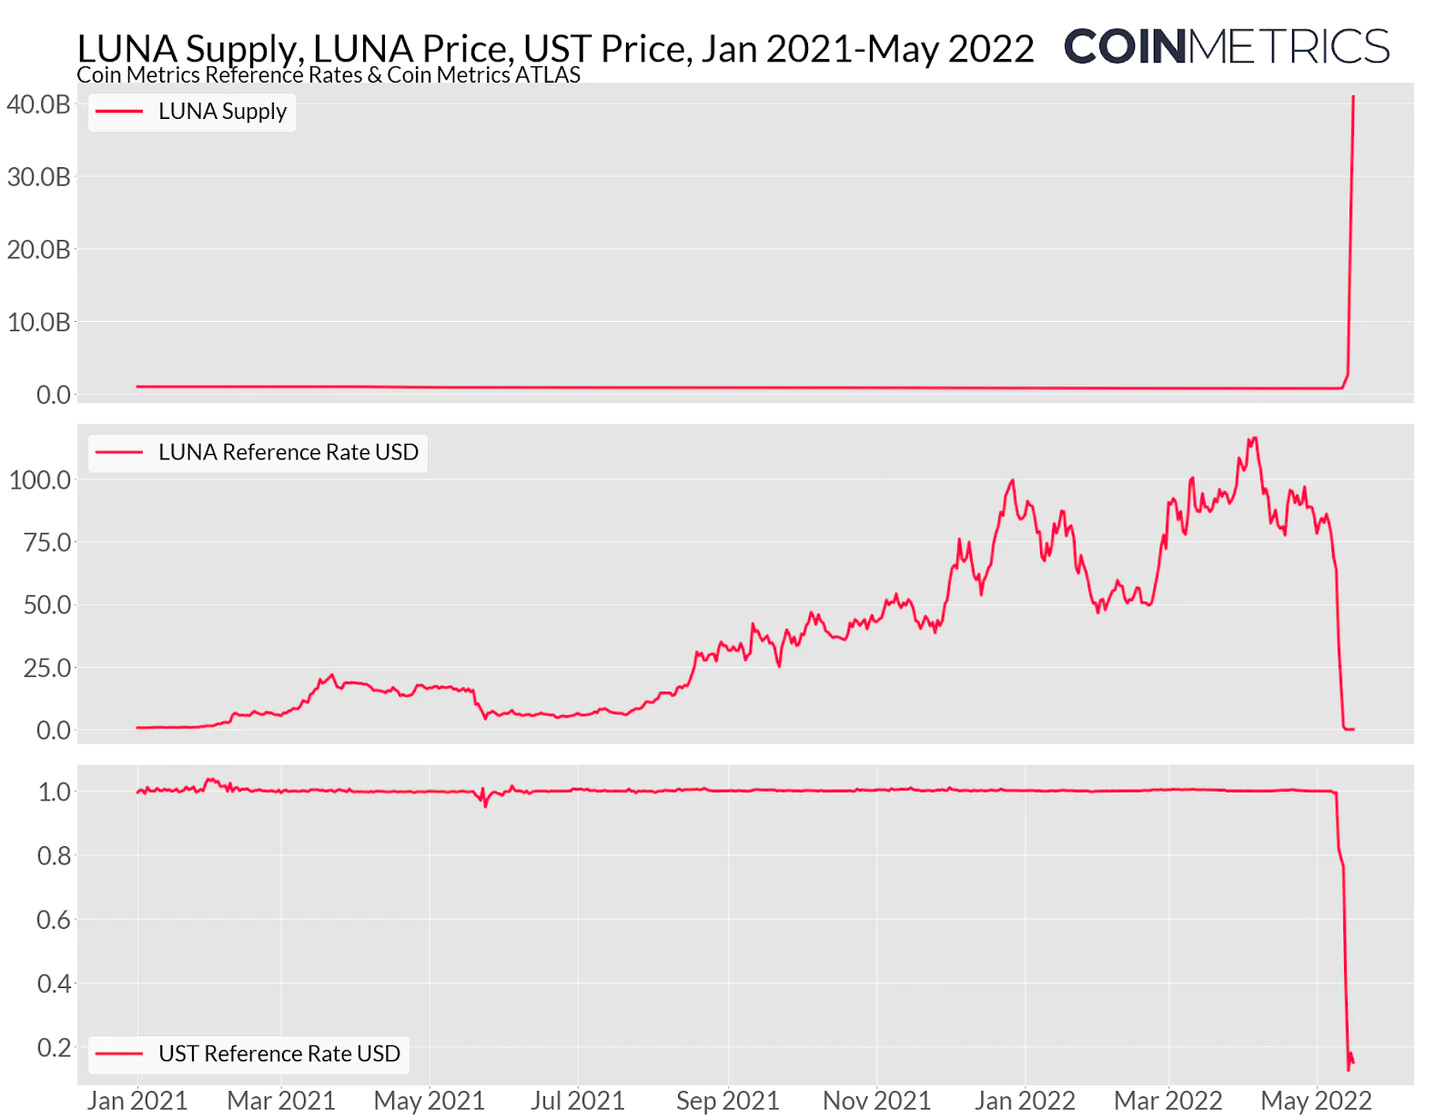
Though April was hectic, the serious turmoil began in early May as the “algorithmic stablecoin” TerraUSD (UST) started falling below its $1 peg. UST supply had ballooned to over $18B going into May, with heavy use within some decentralized finance (DeFi) applications such as Anchor Protocol, that boasted UST yields of up to 19.5%. UST’s peg was predicated on a redemption mechanism that $1 worth of UST could always be exchanged for $1 worth of LUNA, the native token to the Terra blockchain that could be minted endlessly to meet redemption demand.
This worked while LUNA price was going up, but just like many other failed attempts at currency pegs in the past, this flawed design collapsed as both UST and LUNA’s price fell in tandem. As UST holders rushed for the exit, a lower LUNA price meant the need for more LUNA to meet the $1 peg, inflating away existing LUNA holders and leading to a vicious cycle of hyperinflation.
UST’s sudden collapse initiated an increased scrutiny of the entire stablecoin landscape. Days after the worst of the UST/LUNA carnage, Tether (USDT) – the largest stablecoin by total supply today – faced its largest deviation from $1 since March 2020 with USDT price falling briefly as low as $0.95, before rebounding to $0.99.
But despite the price deviation and questions surrounding Tether in the past, USDT has a fundamentally different stabilization mechanism compared to TerraUSD. In short, Tether holds a reserve of cash and cash equivalents as well as some secured loans and corporate bonds. A full breakdown of Tether’s reserves (as of March 31, 2022) can be found on their website.
With the USDT price falling below $1, arbitrageurs lined up to buy USDT at market price and redeem it for the full dollar. Tether’s ability to honor redemptions was put to the test.
On May 12th, Tether handled redemptions totaling $3.3B, by far the largest in its history. Tether handled a total of ~$7.5B in redemptions from May 11th to May 14th, representing a roughly 9% reduction in total supply from about 81B to 73B (on Ethereum, Tron, and Omni; note USDT is issued on other chains but in much smaller quantities).
The chart below shows the daily change in USDT free float supply and total free float supply by day. Coin Metrics’ free float supply removes USDT that is held in Tether’s treasury addresses before it is eventually burnt.
Source: Coin Metrics’ Formula Builder
In total, Tether supply has contracted from 81B to 64B since May 11th, with the redemption system seemingly working as intended.
But with transparency and security at a premium, other stablecoins have seen net gains in total supply. The total supply of USD Coin (USDC) has grown from 42B to 46B on Ethereum since May 11th.
Source: Coin Metrics’ Formula Builder
USDC’s US-based issued Circle has previously committed to becoming a national bank in the United States under the supervision of the Federal Reserve, U.S. Treasury, OCC, and FDIC. In addition, USDC is fully backed by cash and cash equivalents and publishes monthly attestation reports, making it highly trusted amongst the top stablecoins.
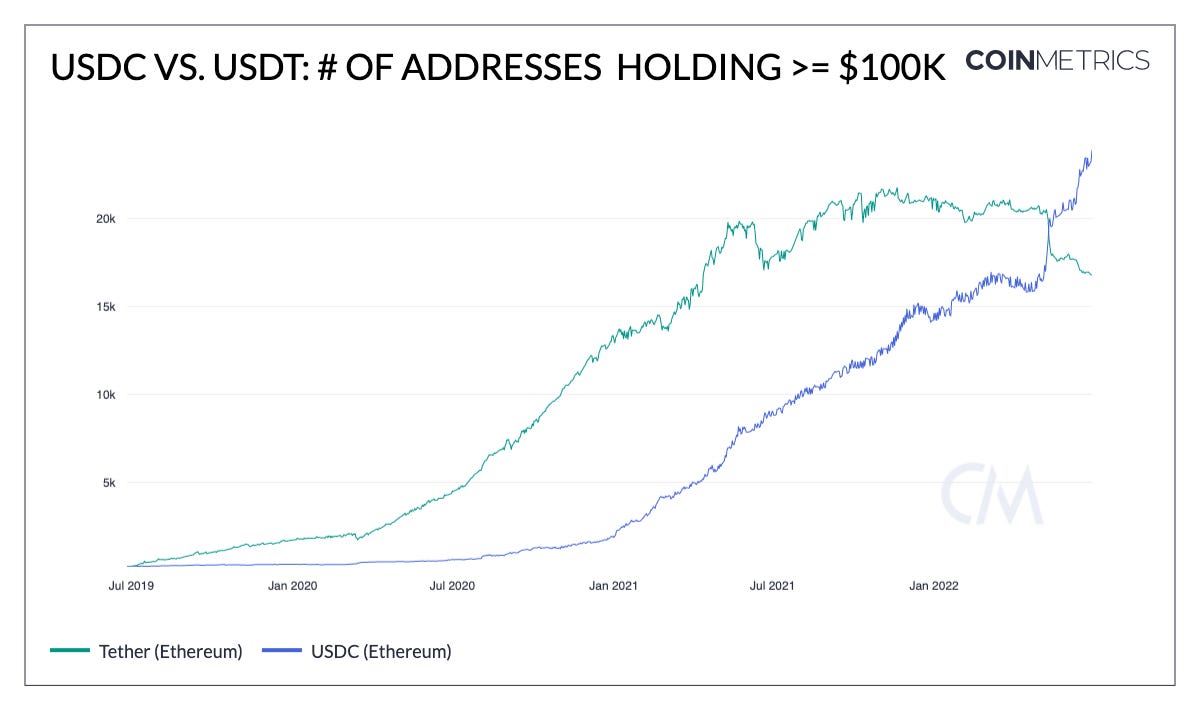
The number of addresses on Ethereum holding at least $100,000 worth of USDC surpassed USDT in early May, growing strongly to nearly 25K while the number of USDT addresses holding that same amount fell under 17K.
Source: Coin Metrics’ Formula Builder
This is likely a function of the USDT redemption process as only large holders are privileged to redeem USDT and capture any arbitrage in the process (Tether sets a redemption minimum of $100K). But it’s also possible that some large accounts were de-risking their holdings, turning to the assurances of USDC.
Weaknesses Emerge Amid Market Contagion
As prices continued to fall throughout May and June, more issues started to appear in the crypto lending markets. On June 12th, crypto asset lender Celsius Network announced that it was pausing all withdrawals, swaps, and transfers of crypto asset accounts on the platform.
Celsius’ solvency issues have ostensibly stemmed at least in part from a series of risky bets within DeFi, including deposits into Lido’s staked ETH (stETH) token. As of the end of Q2, withdrawals were still on pause, with Celsius exploring options including restructuring its debt and seeking a deal.
Shortly thereafter, crypto markets learned of serious trouble at crypto hedge fund Three Arrows Capital (3AC). Crypto lenders BlockFi and Genesis revealed they had liquidated 3AC’s positions as the fund failed to post new collateral and meet margin calls.
A large part of 3AC’s issues appear to have originated from the fund’s outsized position in Grayscale’s bitcoin trust (GBTC). Until early 2021, GBTC traded at a premium to BTC’s price. This induced funds like 3AC to capitalize on an arbitrage opportunity by borrowing BTC, depositing it with Grayscale, and getting GBTC shares back which could then be sold at a premium to the market.
Source: Data from Coin Metrics, Chart Code from Data Always.
According to an SEC filing from January 2021, 3AC held about 39M GBTC shares (worth close to $2B at GBTC’s peak), making the fund the single largest holder of GBTC.
But that premium continued to turn into a steeper and steeper discount to NAV throughout 2021 and this year, reaching a discount as low as 30%. With no way to redeem GBTC shares for the underlying BTC, large positions such as 3AC’s were worth significantly less over time adding pressure to any highly leveraged positions. GBTC also only has a small fraction of BTC daily trading volume, making the large position much harder to market sell as prices dropped. As of June 29th, 3AC was in the midst of a liquidation of its remaining assets.
Conclusion
This part quarter was brutal not just for crypto assets but for all financial markets worldwide. But there are some green shoots on-chain. The number of BTC addresses holding small amounts between 0.01 and 1 BTC has continued to push higher, rising from 8.9M at the start of the quarter to 9.5M today.
Also, while activity has fallen off some, cheaper gas fees on Ethereum also offer new entrants an ability to explore the space with less overhead while developers can experiment for less.
Builders in the space are ultimately continuing forward, with excitement mounting around Ethereum’s long-planned move to proof-of-stake via “The Merge”, which is anticipated later this year. Although battered, the entire crypto ecosystem is building back stronger.
Coin Metrics’ Q2 Updates
This quarter’s updates from the Coin Metrics team:
Coin Metrics announced its $35M Series C round led by Acrew Capital and BNY Mellon, with continued investment from Goldman Sachs and Fidelity investments. Check out our press release here.
We launched data for decentralized exchanges (DEXs) via our market data feed.
Coin Metrics received the Most Innovative Solution Provider award at Hedgeweek’s 2022 European Digital Assets Awards.
As always, if you have any feedback or requests please let us know here.
Subscribe and Past Issues
Coin Metrics’ State of the Network, is an unbiased, weekly view of the crypto market informed by our own network (on-chain) and market data.
If you'd like to get State of the Network in your inbox, please subscribe here. You can see previous issues of State of the Network here.
Check out the Coin Metrics Blog for more in depth research and analysis.
© 2022 Coin Metrics Inc. All rights reserved. Redistribution is not permitted without consent. This newsletter does not constitute investment advice and is for informational purposes only and you should not make an investment decision on the basis of this information. The newsletter is provided “as is” and Coin Metrics will not be liable for any loss or damage resulting from information obtained from the newsletter.


