Coin Metrics' State of the Network: Issue 52
Tuesday, May 26, 2020
Get the best data-driven crypto insights and analysis every week:
Best of the First Year of State of the Network
By Nate Maddrey and the Coin Metrics Team
In this special edition, we look back at the best issues of the past year to celebrate State of the Network’s one-year anniversary.
Over the last 52 issues we have taken a data-driven approach to elucidating the best (and worst) of crypto, powered by Coin Metrics’ network and market data. In this issue we look back at three specific themes that we have covered over multiple issues over the past year:
Transparency and auditability
Valuation and market analysis
Network security and health
We would also like to use this opportunity to wish a big thank you to everyone who has viewed and subscribed to State of the Network over the past year. Please let us know if you have any feedback about State of the Network, especially if you have ideas about how we can keep making it even better. You can submit feedback here.
Transparency and Auditability
At Coin Metrics, transparency and auditability are the foundational building blocks that our data and analysis are built on top of. This starts with running our own nodes for the cryptoassets we cover.
In Issue 30, we ranked full nodes in several tiers (A, B, C, and F) depending on their ease of synchronization, updatability, and maintenance. Below is our ranking for the top 10 assets by market cap (Coin Metrics doesn’t operate Ripple or Stellar nodes, but relies on the APIs provided by both Ripple and the Stellar Foundation).
Source: State of the Network Issue 30
Running our own nodes also allows us to audit supply, and trace which addresses supply flows through. In Issue 32 we investigated the Stellar inflation experiment and found that about 98% of Stellar inflation payments accrued to the Stellar Development Foundation (SDF).
Source: State of the Network Issue 32
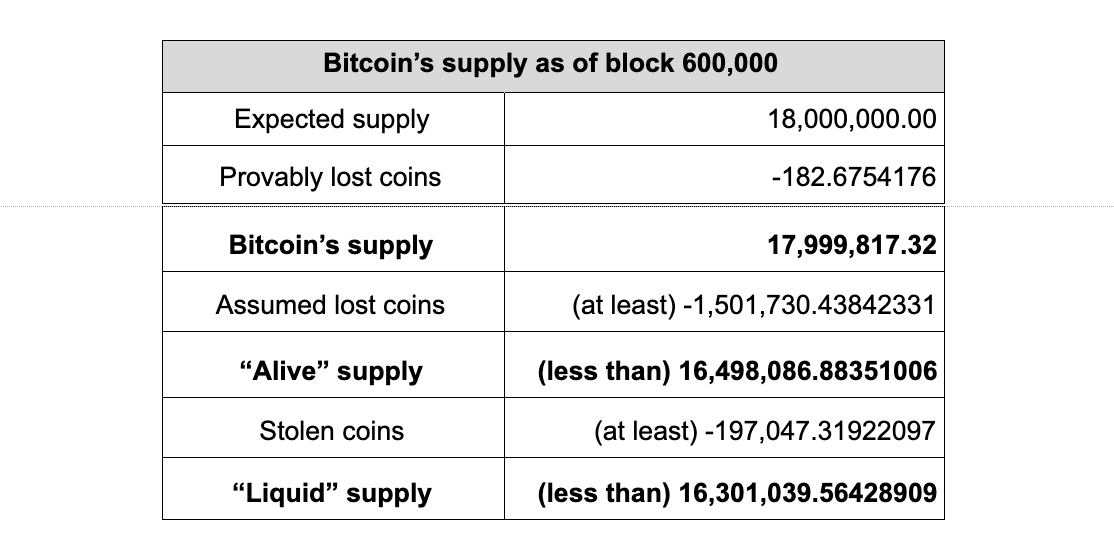
In Issue 26 we did a deep investigation into the nuances of Bitcoin’s supply to determine how many Bitcoins are permanently lost. From those estimates of lost coins, we constructed adjusted views of Bitcoin’s supply.
Source: State of the Network Issue 26
This supply investigation eventually led us to the introduction of CM Free Float Supply in Issue 48, a new metric that is being developed to more accurately represent the supply of an asset available to the market.
Source: State of the Network Issue 48
Accurate supply measurements have also played a foundational role in our research into cryptoasset usage patterns. In Issue 38 we analyzed the supply distribution of eight cryptoassets. We found that Bitcoin and Ethereum were gradually getting more distributed, while BCH and BSV were not.
Source: State of the Network Issue 38
Over the year, we also followed the rapid rise of both the supply and market capitalization of Tether and other stablecoins. Total stablecoin market cap grew from about $4.35B at the beginning of June 2019 to over $10B as of May 2020. We covered the rise of stablecoins in Issue 15, Issue 17, Issue 25, Issue 38, Issue 47, and more.
Source: State of the Network Issue 47
Valuation and Market Analysis
Over the past year we also devoted a lot of time to valuation research and market analysis.
In Issue 37, we released the first part of our “Cryptoasset Valuation Research Primer.” In Part 1 we explored six main categories of crypto valuation research: equation of exchange, discounted future utilities model, Metcalfe’s law, price regression models, cost of production models, and asset bubble identification.
In Part 2 of our cryptoasset valuation primer in Issue 40, we surveyed five additional facets of the literature: fundamental ratios, UTXO age analysis, realized capitalization-based analysis, factor investing, and social media-based analysis. We followed this up with a deep-dive into a specific fundamental ratio, Market Value to Realized Value, in Issue 41.
Source: state of the Network Issue 41
We also analyzed extreme market movements, both positive and negative. In Issue 19, after Bitcoin experienced its largest single-day decline in price in 2019 to date, we used on-chain data to show that selling pressure originated from traders that acquired Bitcoin at prices between $10,000 and $12,000.
Source: State of the Network Issue 19
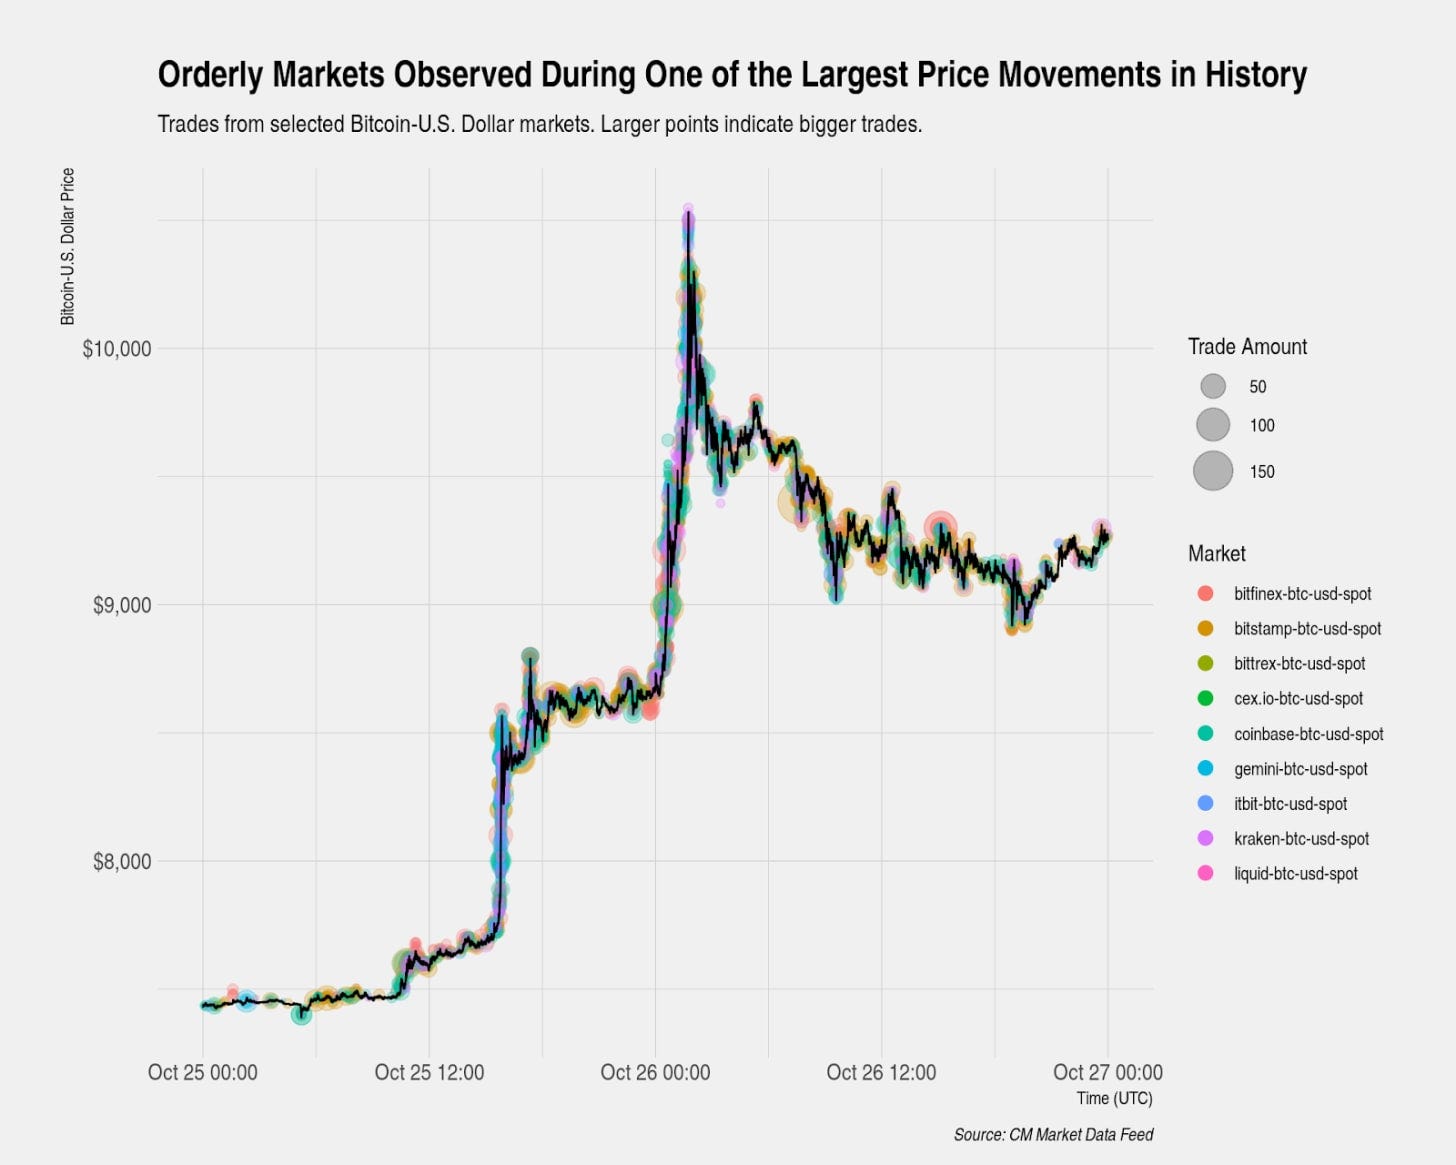
In Issue 23, after Bitcoin bounced back and experienced one of the largest 24-hour returns in its history (at the time), we analyzed our trades data, which is part of our Market Data Feed offering, and found that spreads between major exchanges remained small, indicating that market participants have the ability to quickly transport liquidity across markets.
Source: State of the Network Issue 23
In Issue 42, after the March 12th 2020 crash, we again looked at the spread between exchanges and observed a large spread of around 16% between BitMEX and Coinbase during the sell-off. This was likely due to the BitMEX liquidation spiral after BitMEX went down for unscheduled maintenance in the early hours of March 13th, which we covered in detail in Issue 43.
Source: State of the Network Issue 42
We also used our realtime reference rates to track how Bitcoin reacted to geopolitical and macroeconomic events in real-time. In Issue 33, we analyzed Bitcoin’s response to growing military tensions in Iran.
And in Issue 12, published on August 13th, 2019, we began to analyze the theory that Bitcoin acts as a unique safe haven asset. We revisited the safe haven theory in Issue 33, Issue 39, Issue 45.
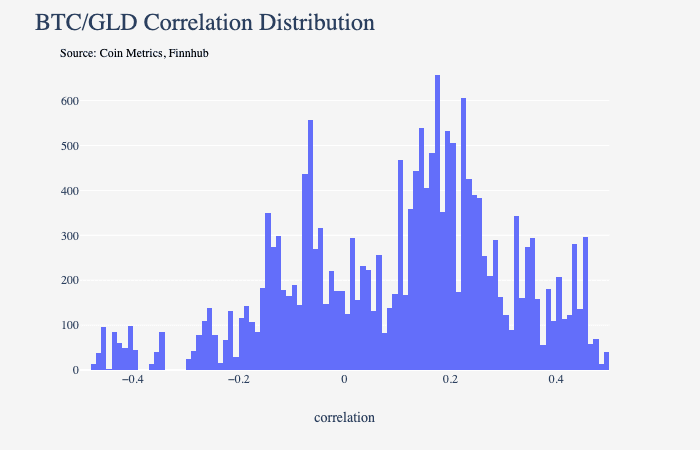
In Issue 46, we conducted a correlation analysis using our reference rates and intraday equity data, and found that while there are pieces of evidence that the correlation between Bitcoin and gold may be growing, Bitcoin’s overall correlation with gold is still relatively weak.
Source: State of the Network Issue 46
Network Security and Health
Security and mining analysis has been another theme for State of the Network over the last year. To assess the long-term health and security of a crypto network, it's critical to track different security metrics like hash rate and miner rewards. It’s also crucial to keep track of hashpower distribution, both among different entities and among different types of mining hardware.
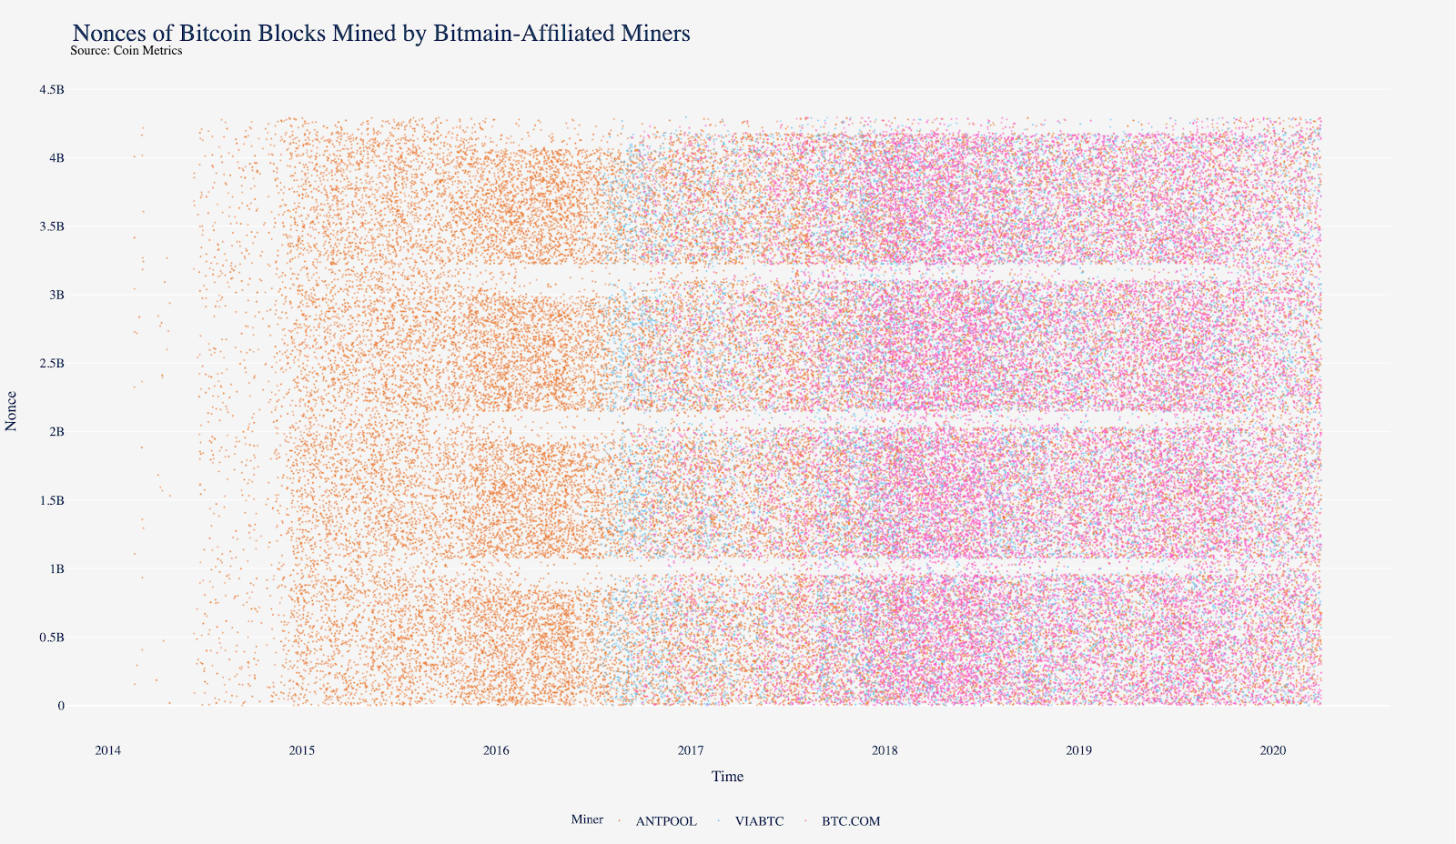
In Issue 23, we started exploring a novel technique of analyzing nonce distributions to find evidence of specialized types of mining hardware called ASICs.
We continued this line of research in Issue 45, where we extended the nonce analysis to identify different mining pools and estimate the usage of specific types of hardware.

Source: State of the Network Issue 45
We revisited the nonce distribution research once again in Issue 51, after Bitcoin’s third halving on May 11th, 2020. Using our techniques for estimating the types of mining hardware being used, we estimated that a significant number of formerly-offline S9s were turned back on prior to the halving. While the amount of hashpower that could be created by offline S9s is nowhere near enough to 51% attack the network, the change to the network’s security dynamics caused by their presence is significant.

Source: State of the Network Issue 51
We also analyzed prior halvings by looking back at historical data. In Issue 44, using a set of axioms, we provided a framework reasoned from first principles that illustrates how miners are a continuous and significant source of selling pressure that has a pro-cyclical impact on prices.

Source: State of the Network Issue 44
Our research on security also led us to designing improved ways to measure it. In Issue 49, we introduced the CMBI Bitcoin Index and ‘Observed Work’ as a more reactive, responsive and manipulation resistant way to measure the realities of mining activity when compared to traditional hash rate estimations.
Additionally, Observed Work and Coin Metrics’ CMBI Bitcoin Hash Rate Index can potentially serve as the foundational pieces of financial products that can provide markets with the required tools to effectively and efficiently trade and/or hedge Bitcoin’s hash rate.

Source: State of the Network Issue 49
Conclusion
It has been a great year of data-driven analysis focused on transparency and auditability, valuation and market analysis, security analysis, and much more. Thanks again for your readership, and please leave us feedback if you have any ideas or comments. We look forward to continuing to bring you the best data-driven crypto stories for years to come.
Coin Metrics Updates
This week’s updates from the Coin Metrics team:
This has been a special edition of State of the Network. The regular format including Network Data and Market Data section will return next week.
Coin Metrics is hiring! Please check out our Careers page to view the openings.
As always, if you have any feedback or requests, don’t hesitate to reach out at info@coinmetrics.io.
Subscribe and Past Issues
Coin Metrics’ State of the Network, is an unbiased, weekly view of the crypto market informed by our own network (on-chain) and market data.
If you'd like to get State of the Network in your inbox, please subscribe here. You can see previous issues of State of the Network here.
Check out the Coin Metrics Blog for more in depth research and analysis.


